
Prior Trading Day Summary
On Wed Jun 3 2026 stocks slid on the back of rising oil prices, an escalation of fighting in the Iran conflict and rising bond yields.
The S&P lost 56 points to end the day at 7553. Volume fell to 5.9 billion shares traded with 77% of all volume being traded lower. By the close 74% of all stocks were falling. For the week the index is down 26 points.
The NASDAQ fell 240 points to close at 26,853. Volume fell to 9.7 billion with 59% of shares being traded lower and 68% of stocks falling. It was the worst single day since May 15 when the index lost 410 points.
With a number of earnings being released after hours on Wednesday which ended up with stocks like Broadcom (AVGO), Crowdstrike (CRWD) and Five Below (FIVE) falling, Thursday looks choppy. There are some changes in the technical indicators for Thursday that investors should be aware of.
Let’s review the closing technical indicators from Wed Jun 3 2026 to see what they predict for Thu Jun 4 2026.
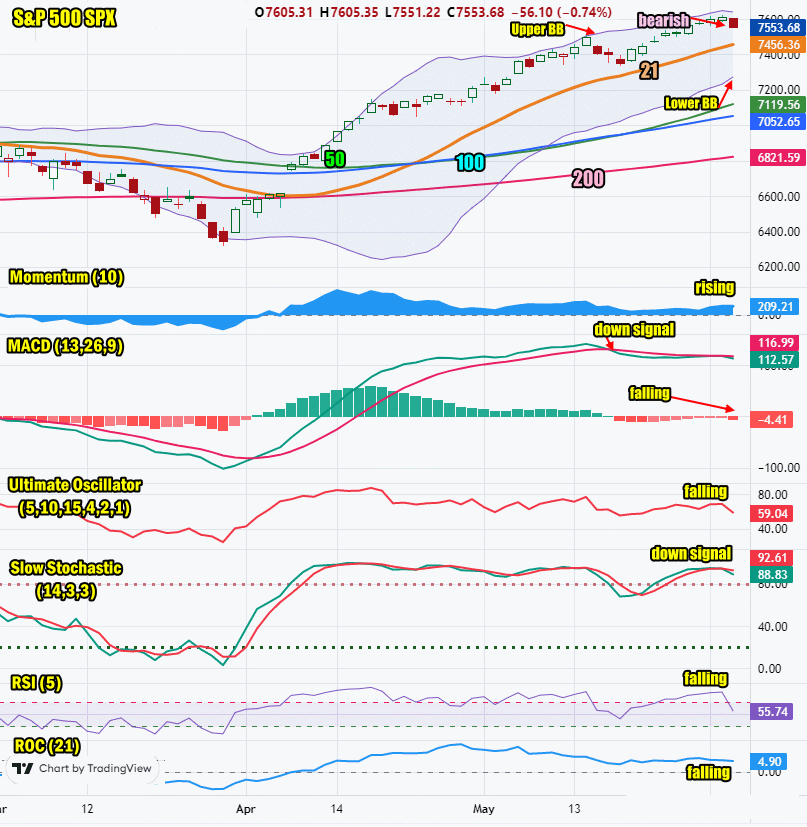
Stock Market Outlook: SPX Closing Chart For Wed Jun 3 2026
The index closed above all major moving averages but dipped below the Upper Bollinger Band by the close. This is bearish.
The closing candlestick is bearish for Thursday.
The 21 day moving average is rising and closed at 7456. This is bullish.
The 50 day moving average is rising and closed at 7119. This is bullish.
The 100 day moving average is rising and closed at 7052. Thit is bullish.
The 200 day moving average is rising and closed at 6821. This is bullish.
The Lower Bollinger Band is climbing which is now bearish. The Upper Bollinger Band is turning lower which is also bearish. This could be the start of a Bollinger Bands Squeeze.
The SPX chart is more bullish than bearish for June 4 but there are signs pointing to a lower day on Thursday.
SPX Stock Market Outlook review of Wed Jun 3 2026
Stock Market Outlook: Technical Indicators Review
Momentum: Momentum is rising and bullish.
|
MACD Histogram: MACD (Moving Averages Convergence / Divergence) issued a down signal on Tue May 19 2026. On Wed Jun 3 2026 the down signal gained strength.
|
Ultimate Oscillator: The Ultimate Oscillator is falling which is bearish.
|
Slow Stochastic: The Slow Stochastic has a down signal in place.
|
Relative Strength Index: The RSI signal is falling which is bearish.
|
| Rate of Change: The rate of change is falling signaling today will end lower. Settings: Rate Of Change is set for a 21 period. This indicator looks back 21 days and compares price action from the past to the present. With the Rate Of Change, prices are rising when signals are positive. Conversely, prices are falling when signals are negative. As an advance rises, the Rate Of Change signal should also rise higher, otherwise the rally is suspect. A decline should see the Rate Of Change fall into negative signals. The more negative the signals the stronger the decline. |
Stock Market Outlook: Support and Resistance Levels |
| 7600 is resistance |
| 7590 is resistance |
| 7570 is resistance |
| 7550 is resistance |
| 7500 is resistance |
| 7450 is resistance |
| 7425 is resistance |
| 7400 is resistance |
| 7370 is resistance |
| 7350 is resistance |
| 7300 is support |
| 7280 is support |
| 7250 is support |
| 7200 is support |
| 7175 is support |
| 7150 is support |
| 7125 is support |
| 7100 is support |
| 7050 is support |
| 7000 is support |
Stock Market Outlook for Thu Jun 4 2026
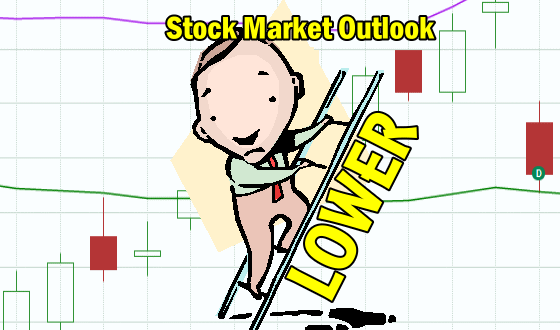
On Wednesday stocks ended the day lower. For Thu Jun 4 2026 the index is set to send stocks lower as the market is finally reacting to the overbought condition along with the price of oil. All of this was being ignored earlier in the month.
Look for stocks to open and fall, then rally and fall again into the close for a negative end to the day.
Potential Economic and Political Market Moving Events
Monday:
9:45 S&P final manufacturing PMI came in slightly lower at 55.1
10:00 ISM manufacturing was stronger than estimated coming in at 54.0
10:00 Construction spending for April rose 0.4% defying analysts who predicted a lower reading.
Auto sales came in slightly above estimated at 16.1 million
Tuesday:
10:00 Job openings for April came in much higher than estimated, at 7.6 million.
Wednesday:
8:15 May ADP employment came in at 122,000 beating estimates of 105,000 prior
9:45 S&P final services PMI for May came in lower at 50.7
10:00 Factory orders for April were stronger at 4.8%
10:00 ISM services for May came in higher than estimated at 54.5%
2:00 Fed’s Beige Book is released
Thursday:
8:30 Weekly Initial Unemployment Insurance Claims for May 30 are estimated to remain unchanged at 215,000
8:30 US Productivity is estimated to stay unchanged at 0.8%