
Prior Trading Day Summary
On Tue Jun 9 2026 stocks had a wild day which saw significant losses only to find buyers return to send the indexes back up.
The S&P fell to 7237 intraday and closed at 7386 down just 19 points at the close. It was a stunning reversal. Up volume jumped to 54% and 62% of all stocks were rising. Both of these were better than Monday’s percentages. The SPX intraday came close to reaching the 50 day moving average before bouncing.
The NASDAQ saw volume jump to 12.5 billion with 51% of all volume being traded higher and 49% of stocks rising on the index by the close. Intraday the NASDAQ also reached its 50 day moving average before bouncing. This was a drop down to 24,980 which is significant. By the close the index lost 250 points sending the NASDAQ to 25,678.
The wild whipsaw might return again today depending on what the inflation readings tell us before the open today.
Let’s review the closing technical indicators from Tue Jun 9 2026 to see what they predict for Wed Jun 10 2026.
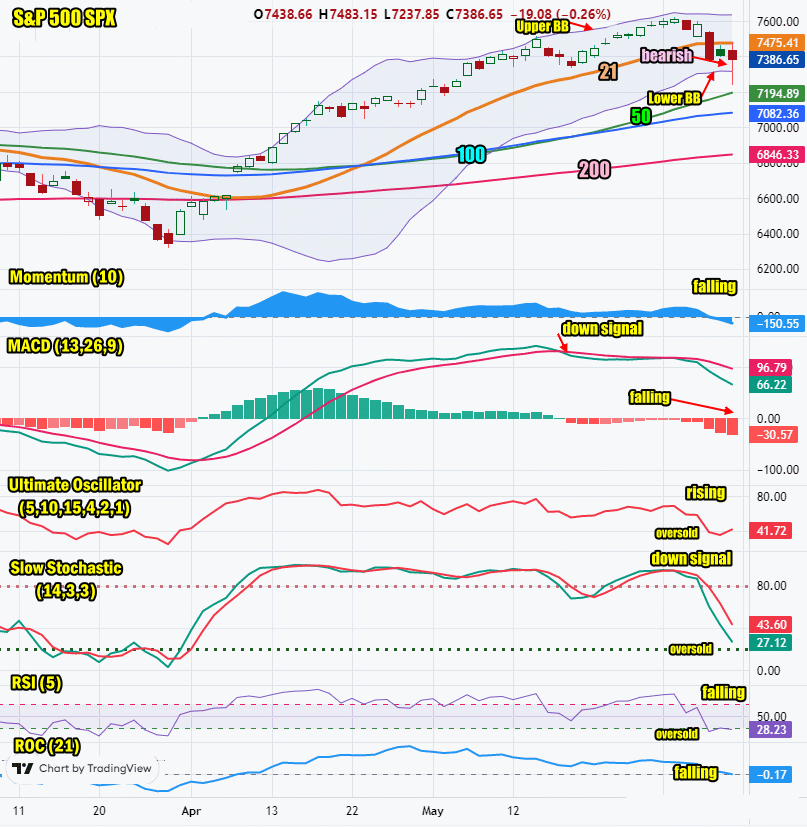
Stock Market Outlook: SPX Closing Chart For Tue Jun 9 2026
The index closed below the 21 day moving average and fell to the 50 day intraday. It is also below the Upper Bollinger Band. This is bearish.
The closing candlestick is bearish for Wednesday but with a long candlestick which indicates markets might try to rally again Wednesday or fall sharply lower.
The 21 day moving average is falling and closed at 7475. This is bearish..
The 50 day moving average is rising and closed at 7194. This is bullish.
The 100 day moving average is rising and closed at 7082. Thit is bullish.
The 200 day moving average is rising and closed at 6846. This is bullish.
The Lower Bollinger Band is sideways which is bearish. The Upper Bollinger Band is heading lower which is also bearish. This could be the start of a Bollinger Bands Squeeze for this week.
The SPX chart is more bearish than bullish for June 10.
SPX Stock Market Outlook review of Tue Jun 9 2026
Stock Market Outlook: Technical Indicators Review
Momentum: Momentum is falling and negative. This is bearish.
|
MACD Histogram: MACD (Moving Averages Convergence / Divergence) issued a down signal on Tue May 19 2026. On Tue Jun 9 2026 the down signal gained strength and is at readings where a bounce is likely.
|
Ultimate Oscillator: The Ultimate Oscillator is rising and oversold. A bounce is likely.
|
Slow Stochastic: The Slow Stochastic has a down signal in place. It is at readings where an oversold bounce is likely.
|
Relative Strength Index: The RSI signal is rising and oversold. A bounce is likely.
|
| Rate of Change: The rate of change is falling signaling today will end lower. Settings: Rate Of Change is set for a 21 period. This indicator looks back 21 days and compares price action from the past to the present. With the Rate Of Change, prices are rising when signals are positive. Conversely, prices are falling when signals are negative. As an advance rises, the Rate Of Change signal should also rise higher, otherwise the rally is suspect. A decline should see the Rate Of Change fall into negative signals. The more negative the signals the stronger the decline. |
Stock Market Outlook: Support and Resistance Levels |
| 7600 is resistance |
| 7590 is resistance |
| 7570 is resistance |
| 7550 is resistance |
| 7500 is resistance |
| 7450 is resistance |
| 7425 is resistance |
| 7400 is resistance |
| 7370 is resistance |
| 7350 is resistance |
| 7300 is support |
| 7280 is support |
| 7250 is support |
| 7200 is support |
| 7175 is support |
| 7150 is support |
| 7125 is support |
| 7100 is support |
| 7050 is support |
| 7000 is support |
Stock Market Outlook for Wed Jun 10 2026
Tuesday’s reversal from the lows of the day was impressive and on good volume. Today though will start with the inflation numbers. Stocks could move either way depending on the latest inflation reading. Tonight we get earnings from Oracle (ORCL) which would affect Thursday’s market direction. You can see then h of mixed the index outlook is and how the chance of a move either direction is hard to pinpoint.
On Thursday before the open we get the latest Producer Price Index numbers which are also an inflation predictor. These numbers could also impact stocks.
Potential Economic and Political Market Moving Events
Monday:
no reports scheduled
Tuesday:
6:00 NFIB optimism index fell lower than estimated, to 95.3.
8:30 April trade balancewas better than estimated at -$55.9 billion better than the last reading of -$56.6 billion
10:00 Existing home sales for May were stronger than estimated at 4.17 million, up from 4.02 million prior
10:00 Wholesale inventories for April were better than estimated coming in at 0.6% but still below the 1.5% reading from the last report
Wednesday:
8:30 CPI for May is estimated to fall slightly to 0.5% from 0.6% prior
8:30 CPI year-over-year is estimated to jump to 4.2% from 3.8% prior
8:30 Core CPI for May is estimated to fall to 0.3% from 0.4% prior
8:30 Core CPI year-over-year is estimated to rise to 2.9% from 2.8%
2:00 Monthly federal budget is estimated at -$292 billion versus -$316 billion prior
Thursday:
8:30 Weekly Initial Unemployment Insurance Claims for June 6 are estimated at 220,000
8:30 Producer Price Index for May is estimated to fall to 0.7% from 1.4% prior
8:30 Core PPI is estimated to drop to 0.4% from 0.6% prior
8:30 PPI yea over year is estimated unchanged at 6.0%
8:30 Core PPI year-over-year is estimated unchanged at 4.4%