
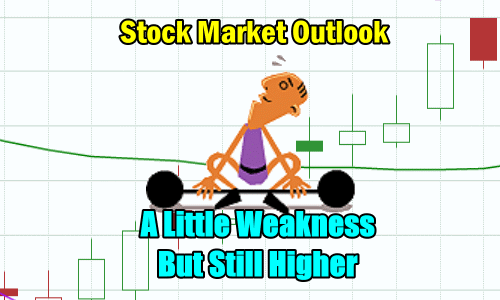
The stock market outlook for Thu Jul 19 2018 was for the index to experience further weakness but still manage to push higher by the close.
Instead the index struggled throughout the day but held above the 2800 level, closing at 2804.49.
All three indexes dipped and the Dow marked the end of its 5 day winning streak. The close saw the down down to 25064.50 for a half percent drop. This wiped out the last three days of gains for the Dow Jones Index.
Stock Market Outlook Chart Comments At The Close on Thu Jul 19 2018
The S&P ended the day on Wednesday still above 2800.
All the major moving averages are rising with the 50 day continuing to quickly rise.
The closing candlestick on Thursday was bearish for Friday.
The Bollinger Bands are continuing to signal the index will move higher.
The chart is overall still bullish.

Stock Market Outlook review of Thu Jul 19 2018
Stock Market Outlook: Technical Indicators Review:
Momentum: For momentum I use a 10 period when studying market direction. Momentum is positive and falling.
MACD Histogram: For MACD Histogram, I am using the Fast Points set at 13, Slow Points at 26 and Smoothing at 9. MACD (Moving Averages Convergence / Divergence) issued an up signal on July 9. The up signal was still strong on Thursday.
Ultimate Oscillator: The Ultimate Oscillator settings are: Period 1 is 5, Period 2 is 10, Period 3 is 15, Factor 1 is 4, Factor 2 is 2 and Factor 3 is 1. These are not the default settings but are the settings I use with the S&P 500 chart set for 1 to 3 months. The Ultimate Oscillator signal is positive and falling.
Slow Stochastic: For the Slow Stochastic I use the K period of 14 and D period of 3. The Slow Stochastic tries to predict the market direction further out than just one day. The Slow Stochastic is extremely overbought and has a down signal in place for Friday.
Relative Strength Index: The relative strength index is set for a period of 5 which gives it 5 days of market movement to monitor. It is often the first indicator to show an overbought or oversold signal. The RSI signal is falling and is slightly overbought.
Rate of Change: Rate Of Change is set for a 21 period. This indicator looks back 21 days and compares price action from the past to the present. With the Rate Of Change, prices are rising when signals are positive. Conversely, prices are falling when signals are negative. As an advance rises the Rate Of Change signal should also rise higher, otherwise the rally is suspect. A decline should see the Rate Of Change fall into negative signals. The more negative the signals the stronger the decline. The rate of change signal is positive but moving sideways.
Support Levels To Be Aware Of:
2745 to 2750 is light support
2725 is light support.
2700 is support.
2675 is light support.
2650 is light support
2620 is light support
2600 is strong support.
There is good support at the 2550 level from where the market bounced back from the recent correction low on Feb 9.
The S&P has light support at 2480. It also has light support at 2450 and good support at 2425. Below that there is some support at 2400, 2380, 2350. 2300 has the most support at present but would represent a full correction as a drop to this level would be 20% and just 5% away from a potential bear market signal.
Stock Market Outlook for Tomorrow – Fri Jul 20 2018
What a difference a day can make. Just a bit of weakness on Thursday has changed most of the technical indicators to falling and one, the Slow Stochastic, has a sell signal in place.
While the technical indicators are showing some strain, there is still a lot of strength in the index. The readings, even though they are falling, are still quite bullish.
Normally technical readings such as we can see in the chart above after the close on Thursday, are followed by a weak Friday morning but a higher close.
For Friday, I am expecting the morning to open higher thanks to Microsoft earnings, and then dip lower displaying weakness. A drop should not be deeper than 2795 at the most. I would think any drop would not fall much below 2800 on Friday. From there we should see the index move higher and close higher than Thursday’s close. I had expected a move to 2820 on Thursday. That move is no longer expected this week.
Stock Market Outlook Archives
Stock Market Outlook For Wed May 6 2026 – Choppy But Higher Still

Morning Investing Strategy Notes for Tue May 5 2026

Stock Market Outlook For Tue May 5 2026 – Overbought and Lower

Morning Investing Strategy Notes for Mon May 4 2026
Stock Market Outlook For Mon May 4 2026 – Dips Likely With Possible Lower Close

Morning Investing Strategy Notes for Fri May 1 2026
Stock Market Outlook For Fri May 1 2026 – Overbought But Higher

Morning Investing Strategy Notes for Thu Apr 30 2026
Stock Market Outlook For Thu Apr 30 2026 – Dips Likely Possible Lower Close
Morning Investing Strategy Notes for Wed Apr 29 2026
Stock Market Outlook For Wed Apr 29 2026 – Choppy But Higher Ahead Of More Earnings

Morning Investing Strategy Notes for Tue Apr 28 2026