
One of the best market timing systems I have found is using the Weekly Initial Unemployment Insurance Claims to time how much capital to commit to stocks, when to commit it and what types of trade strategies to employ. While nothing is perfect, the Weekly Initial Unemployment Insurance Claims market timing system has been the best I have found to date and rivals the Toronto Stock Exchange Commodities market timing system for the number one spot. The TSX commodities market timing system has been quite good for the past two years, but the Weekly Initial Unemployment Insurance Claims system has not made a mistake once during the same time period.
ADP Payroll Numbers
Sometimes we can get a glimpse or preview of what the Weekly Initial Unemployment Insurance Claims may show for the coming week, when the ADP Research Institute of Roseland, New Jersey releases their payroll numbers for the prior month. Today the ADP numbers showed that 281,000 workers were added to payrolls. This is the biggest jump since November 2012 but falls in line with the various Weekly Initial Unemployment Insurance Claims that show the economy continues to gain momentum and add more jobs.
July 4 Holiday – June Unemployment Numbers
The July 4 holiday means the June unemployment numbers will be released on Thursday, the same day the latest Weekly Initial Unemployment Insurance Claims are to be released. Most economists are expecting the nonfarm payroll numbers for June will come in around 215,000, showing continued job growth.
Today’s ADP payroll numbers seem to be pointing to better than expected numbers for Thursday July 3.
Stay Invested But Rates Will Rise
I had written back on June 19 that the June employment numbers would give us a better indication of how well the economy is doing. Tomorrow we get to find out but the ADP numbers show strength in employment which means interest rates will definitely rise, even if just slightly, probably by early Spring or even earlier perhaps at the start of 2015.
Market Timing System Says Stay Invested
I have for years used the Weekly Initial Unemployment Insurance Claims to advise when to apply more capital, when to pull back and when to raise more cash than usual and move to the downside for trading. Years ago I developed the chart you see below as a market timing system guideline.
Weekly Numbers Above 350,000 and Climbing
I focus more on selling in the money covered calls and doing Spy Put Options aggressively. As the weekly claims rise and get closer to 400,000 I normally buy puts on stocks that based on chart patterns I believe are overvalued and will pull back if the market direction corrects. I tend to place fewer trades and begin to raise cash. Above 400,000 I raise a lot more cash.
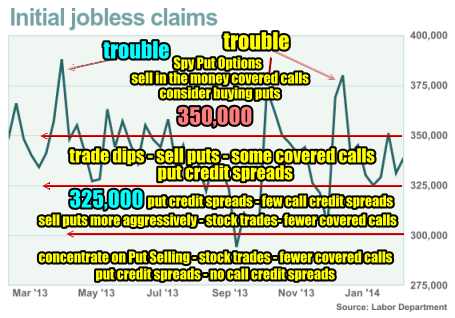
Weekly Numbers Between 325,000 to 350,000
When the weekly numbers move below 350,000 but stay above 325,000, such as the period now, I focus on trading dips in stocks through selling puts usually naked, doing some put credit spreads and doing some covered calls. This is because in this range normally the market can still move higher but it is more difficult for it to be a straight line up. This means I can sell some covered calls when the market is pushing higher because the likelihood of it not pushing too high is greater. This will leave my covered calls normally out of the money and expired. I also pick up some stocks for short-trades often referred to as swing trades or even day trades although I do not do many day trades. This is a good place for put credit spreads as well since it offers more protection than selling puts naked. This is also not too bad an area for call credit spreads as stocks may have a more difficult time rising too quickly or high enough to place call credit spreads at risk. I tend though not to do a lot of call credit spreads. I prefer being on the Put Selling side.
Weekly Numbers Between 300,000 to 325,000
When the numbers fall below 325,000 stocks have a much easier time moving higher. This means being careful with covered calls unless I do not want to own the stock and would like to be exercised out. It also means being careful on call credit spreads which I do rarely as explained previously. I sell puts far more aggressively here and will definitely consider put credit spreads as well.
Weekly Numbers Below 300,000
Below 300,000 the market direction rarely corrects. This means I concentrate heavily on Put Selling, doing stock trades particularly using the Bollinger Bands Strategy Trade.
I do very few covered calls, although in my retirement account I do a lot of covered calls on stocks I want exercised. This is because in Canada investors are not allowed to sell puts, even cash secured puts, in our retirement or tax-free accounts. Therefore I look to set up covered calls trades wherever practical to earn profits that can compare to Put Selling trades. This is not always as easy as it might appear. Put Selling is far superior to covered calls in my opinion. You can read this article to understand why.
At the level below 300,000 I increase the quantities of naked puts I sell and as the numbers fall to 250,000 or more I bring more cash into play. I do no call credit spreads but the number of naked puts is easily 4 or more times higher. When the Weekly Initial Unemployment Insurance Claims get to this level the economy is usually booming and stocks are doing well.
ADP Numbers and Market Timing System Summary
While the Weekly Initial Unemployment Insurance Claims numbers advise to stay invested at this stage, the ADP numbers are advising that interest rates at zero will only last a while longer. The Weekly Initial Unemployment Insurance Claims system cannot be relied upon to pinpoint when the next pullback will occur based on interest rate rises. There has never been a period in time when interest rates have been at zero while this market timing system was in effect. Therefore a rise in interest rates in early 2015 may see nervous investors taking profits either this fall or early winter depending on the outlook as we move through the rest of the summer period.
While I have used the Weekly Initial Unemployment Insurance Claims for years, it is not perfect and a rise in interest rates, even a slight one, will signal the end of the zero era and while it may be signaling to stay invested, nervous investors may be moving out of stocks worried that interest rates will rise faster and higher than originally anticipated by either the Federal Reserve, economists or investors.
The ADP numbers should be watched over the summer months for signs of further healing to unemployment. If numbers continue to show strength, interest rates cannot stay at zero forever. They will rise and pressure equities. I will be watching this system and the ADP numbers for these types of signs and will make adjustments to my portfolio as needed. For now though, these numbers still say “stay invested”.
Market Timing System Internal Links
Profiting From Understanding Market Direction (Articles Index)
Understanding Short-Term Signals
Market Direction Portfolio Trades (Members)