

Prior Trading Day Summary
On Thursday earnings from a number of big cap stocks like Alphabet Stock (GOOGL) and Eli Lilly Stock (LLY) helped to push the indexes to new all-time highs yet again.
The SPX rose 73 points to close at 7209 on 5.8 billion shares traded. 78% of all stocks were climbing by the close.
The NASDAQ gained 219 points to close at 24,673 with 71%% of stocks on the index rising. Volume slipped slightly to 8.3 billion.
Earnings from Apple among others after hours on Thursday were strong. Apple had its best earnings report since before the pandemic. Despite analysts warning of a decline in sales, Apple surprised with very strong numbers across all aspects of its immense business. These earnings should be enough to keep the SPX higher on Friday.
Let’s review the closing technical indicators from Thu Apr 30 2026, to see what they predict for Fri May 1 2026..
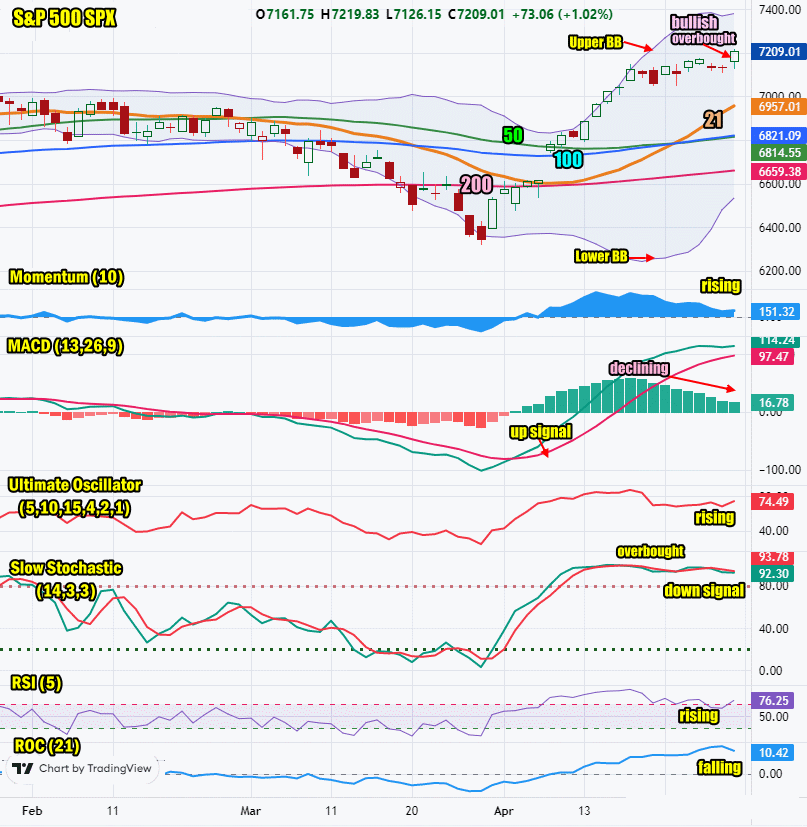
Stock Market Outlook: SPX Closing Chart For Thu Apr 30 2026
The index closed above all major moving averages but inside the Upper Bollinger Band for an ninth day. The index is back climbing which is bullish.
The closing candlestick is bullish for Friday. The index closed at a new all-time high which is bullish.
The 21 day moving average is rising sharply and closed at 6957. This is bullish and places the 21 day further above the 50 and 100 day moving averages.
The 50 day moving average is rising and closed at 6814. This is bullish but below the 100 day moving average.
The 100 day moving average is rising and closed at 6821. This is bullish but we need to see the 50 day move above the 100 day this week..
The 200 day moving average is rising and closed at 6659. This is bullish.
The Lower Bollinger Band is turning higher. The Upper Bollinger Band is turning sideways. This is bearish.
The SPX chart is more bullish than bearish for Friday and shows overbought but a higher day is expected.
SPX Stock Market Outlook review of Thu Apr 30 2026
Stock Market Outlook: Technical Indicators Review
Momentum: Momentum is rising. This is bullish.
|
MACD Histogram: MACD (Moving Averages Convergence / Divergence) issued an up signal on Fri Apr 7 2026. On Thu Apr 30 2026 the up signal lost more strength despite the large rally. This is bearish.
|
Ultimate Oscillator: The Ultimate Oscillator is rising.
|
Slow Stochastic: The Slow Stochastic has a down signal in place. It is extremely overbought. It is at levels where a pullback should be expected.
|
Relative Strength Index: The RSI signal is rising.
|
| Rate of Change: The rate of change is falling and signaling a lower close is likely. Settings: Rate Of Change is set for a 21 period. This indicator looks back 21 days and compares price action from the past to the present. With the Rate Of Change, prices are rising when signals are positive. Conversely, prices are falling when signals are negative. As an advance rises, the Rate Of Change signal should also rise higher, otherwise the rally is suspect. A decline should see the Rate Of Change fall into negative signals. The more negative the signals the stronger the decline. |
Stock Market Outlook: Support and Resistance Levels |
| 7190 is resistance |
| 7175 is resistance |
| 7150 is resistance |
| 7125 is resistance |
| 7100 is resistance |
| 7050 is resistance |
| 7000 is resistance |
| 6950 is resistance |
| 6900 is resistance |
| 6850 is resistance |
| 6830 is resistance |
| 6800 is support |
| 6780 is support |
| 6750 is support |
| 6735 is support |
| 6700 is support |
| 6675 is support |
| 6650 is support |
| 6625 is support |
| 6600 is support |
Stock Market Outlook for Fri May 1 2026
For Friday earnings from Apple Stock (AAPL) on its own may be enough to keep investors buying. The outlook remains strongly positive despite warnings signs of stocks being overbought. Stocks though can stay overbought for long periods of time. Friday is set to end the day higher.
Potential Economic and Political Market Moving Events
Monday:
No reports are released
Tuesday:
9:00 Case-Shillier home price index is fell more than estimated to 0.9%
10:00 Consumer confidence was stronger than estimated, rising to 92.8 for April
Wednesday:
8:30 Durable goods orders for March were higher than estimated, coming in at 0.8%
8:30 Housing starts delayed from Feb came in as estimated at 1.36 million
8:30 Building permits delayed from March were higher than estimated as they came in at 1.54 million
8:30 House starts for March were higher than estimated coming in at 1.36 million
8:30 Building permits for March came in below estimates at 1.37 million
2:00 FOMC interest rate decision is expected to be a non-event with no change
2:30 Fed Chair Powell news conference may be his last as Fed chair
Thursday:
8:30 Weekly Initial Unemployment Insurance Claims came in lower than estimated at 189,000.
8:30 GDP came in at 2.0% slightly lower than estimated
8:30 PCE index came in at 0.7% for March which was higher than 0.4% prior
8:30 Core PCE came in slightly lower at 0.3% down from 0.4% prior
Friday:
9:45 S&P final manufacturing PMI is estimated at 53.9 for April
10:00 ISM manufacturing is estimated at 53.0 for April