FullyInformed.com
Generic filters
Exact matches only
Search in title
Search in content
Search in excerpt

Market Timing / Market Direction Running Out Of Steam

Jan 17, 2012 | Stock Market Outlook

Market Timing indicators in my report for January 12 2012 showed that the market was pushing into overbought territory and the rate of change market timing indicator was flashing some caution signs. I indicated in that report that it was not the best time to consider put selling, but certainly covered calls could be sold.

After today’s close the market timing indicators are all warning that the market is starting to run out of steam and market direction is about to change. In my market timing / market direction article of January 11 2012 I indicated that January options expiration week normally starts strong and then weakness comes into the market.

My market timing indicators are all confirming this change in market direction trend from up to down. This could be a slight dip which would make for nice put selling opportunities going into February and March or the market direction could pull back a bit further than some analysts expect.

Market Timing / Market Direction Indicators for Jan 17 2012

My market timing indicators are all moving lower. Momentum is still fairly good at 102.87 , but MACD is turning lower, followed by the Ultimate Oscillator. The rate of change market timing indicator has failed to regain any traction and is continuing to move lower despite today’s move higher in the market.

Fast and Slow Stochastics are both turning down.

None of these market timing indicators are warning of anything major in the works. Just a dipping of the overall market.
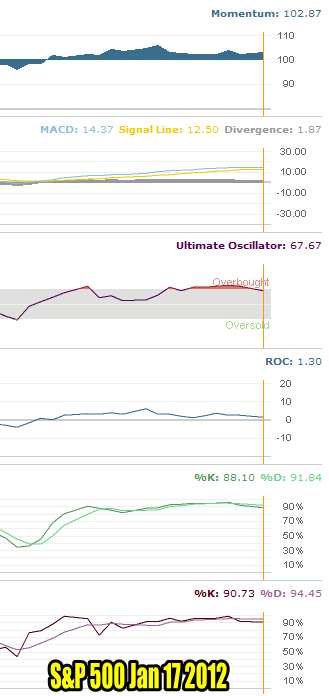
Market Timing / Market Direction Indicators For Jan 17 2012

Market Timing Indicators are ALL pointing lower

It has been a terrific rally from Nov 25 to today. The market has had a great move and I am expecting all my sold January puts to expire out of the money.

Market Timing Indicators How Low Could The Market Direction Go?

Looking at the S&P 500 chart below we can see that the S&P 500 has broken the October highs of 1292.66 made on Oct 27 2011, but there has been no real follow through. Today’s S&P closed at 1293.67 after being up as high as 1303.00.

Volume is declining on the S&P which would seem to indicate that many professional traders have sold and are back into cash waiting to see where the next market direction could take stocks.

I believe the first move lower could be around 1250 or about 3% to 3.5% lower. I would expect a bounce off 1250. If there is no bounce then 1240 holds the next level. After that there is support at 1210.
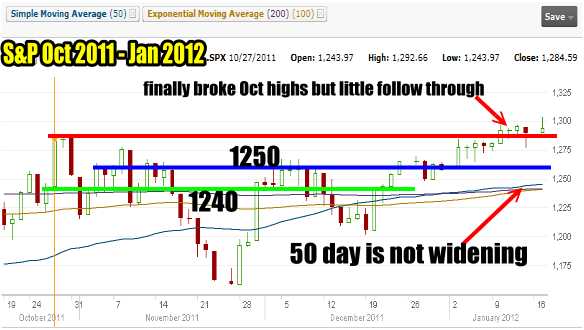
Market Timing / Market Direction Chart For Nov 2011 - Jan 2012

Market Timing / Market Direction Chart For Nov 2011 to jan 2012 shows very little follow through after breaking the Oct highs

Market Timing / Market Direction Summary for Jan 17 2012

I am expecting weakness as confirmed by my market timing indicators but unless something worst hits the market, such as Europe again, I am not expecting a decline of anything greater that 3.5%. I think today marked a good covered call selling opportunity. I am expecting some decent put selling opportunities this week and possibly into next.

While presently my market timing indicators are just warning that the rally has run out steam, they are not warning of any major in the way of market direction change lower. For this reason I have not yet bought SPY Puts. However if the market timing indicators show a stronger move lower coming I will put in place my spy put hedge and post it to my blog.

Recent Outlooks

Stock Market Outlook For Tue Jun 10 2025 – Choppy – Dips Likely But Higher

Prior Trading Day Summary: On Mon Jun 9 2025 indexes closed slightly positive in what was a choppy session. For much of the day the SPX was trading above 6010 but the final hour saw stocks fall back. The SPX …

Morning Investing Strategy Notes for Mon Jun 9 2025

For FullyInformed Members the morning Investing Strategy Notes for Mon Jun 9 2025 review the outlook for the start of the second week of June which, historically, is poor for stocks.. Stocks discussed today include SPY ETF, TQQQ ETF and …

Stock Market Outlook For Mon Jun 9 2025 – Choppy With Bias Higher

Prior Trading Day Summary: On Fri Jun 6 2025, the May Non-Farm Payroll Numbers were better than economists had estimated and the indexes moved higher. The S&P climbed 61 points to end the day at 6000. This is the first …

Morning Investing Strategy Notes for Fri Jun 6 2025

For FullyInformed Members the morning Investing Strategy Notes for Fri Jun 6 2025 review the outlook for the May Non-Farm Payroll Numbers. Stocks discussed today include Broadcom Stock (AVGO), DocuSign Stock (DOCU) and more. The morning Investing Strategy Notes are …

Stock Market Outlook For Fri Jun 6 2025 – All About May Jobs Numbers

Prior Trading Day Summary: On Thu Jun 5 2025 stocks were primarily under selling pressure after coming within a point of reaching 6000 over the lunch hour. Arguments between President Trump and Elon Musk took center stage, holding investors focus …

Morning Investing Strategy Notes for Thu Jun 5 2025

For FullyInformed Members the morning Investing Strategy Notes for Thu Jun 5 2025 review the outlook the day ahead of May’s Non-Farm Payroll Numbers being released. Stocks discussed today include MongoDB Stock (MDB), PepsiCo Stock (PEP),  Microsoft Stock (MSFT), Broadcom …

Stock Market Outlook For Thu Jun 5 2025 – Weakness – Dips Likely – Still Bullish

Prior Trading Day Summary: On Wed Jun 4 2025 stocks opened lower as ADP numbers came in far below estimates which spooked investors. By the close, investors had regained Tuesday’s close. The SPX closed unchanged at 5971 on 4.8 billion …

Morning Investing Strategy Notes for Wed Jun 4 2025

For FullyInformed Members the morning Investing Strategy Notes for Wed Jun 4 2025 review the outlook for the remainder of the week. Stocks discussed today include NVIDIA Stock (NVDA), Wells Fargo Stock (WFC), SQQQ ETF, IWM ETF, Crowdstrike Stock (CRWD), …

Stock Market Outlook For Wed Jun 4 2025 – Mixed Outlook But Still Bullish

Prior Trading Day Summary: On Tue Jun 3 2025 stocks opened lower and spent the day rallying to once again end positive. The SPX rose 34 points to close at 5970. Volume jumped to 5.1 billion and new highs came …

Morning Investing Strategy Notes for Tue Jun 3 2025

For FullyInformed Members the morning Investing Strategy Notes for Mon Jun 2 2025 review the outlook for Tuesday following Monday’s late afternoon rally. Stocks discussed today include SQQQ ETF, IWM ETF, Apple Stock (AAPL), and more. The morning Investing Strategy …

Stock Market Outlook For Tue Jun 3 2025 – Weakness Continuing

Prior Trading Day Summary: On Monday stocks spent the day recovering from a morning sell-off and by the late afternoon it was up 24 points. The close saw the SPX at 5935. Volume was low at 4.9 billion shares but …

Morning Investing Strategy Notes for Mon Jun 2 2025

For FullyInformed Members the morning Investing Strategy Notes for Mon Jun 2 2025 review the outlook for June looking at past years as well as the current one. Stocks discussed today include SQQQ ETF, IWM ETF, Signet Jewelers Stock (SIG), …

Stock Market Outlook For Mon Jun 2 2025 – Weakness To Start June 2025

Prior Trading Day Summary: Stocks encountered some selling on the final day of trading in May which historically is common. The S&P ended the day down just half a point at 5911. Volume was higher by 2 billion shares with …

Morning Investing Strategy Notes for Fri May 30 2025

For FullyInformed Members the morning Investing Strategy Notes for Fri May 30 2025 look at the expected market action for the final trading day of May. Stocks discussed today include Costco Stock (COST), Dell Technologies Stock (DELL), Marvell Stock (MRVL), …

Subscribe For The Latest News