FullyInformed.com
Generic filters
Exact matches only
Search in title
Search in content
Search in excerpt

Market Direction Outlook For Sep 23 2013 – Sideways

Sep 22, 2013 | Stock Market Outlook

For Friday I had expected weakness with a possible push back into the close. This of course did not happen. The weakness in the morning led to a more severe downturn as the day progressed. By the end of the day investors were dumping stocks faster and harder pushing down the Dow and keeping the S&P 500 deep in the red. The strongest market on Friday was definitely the NASDAQ. This is somewhat significant as it has been the NASDAQ which has led the market recovery from the 2008 to 2009 bear market. The NASDAQ lost only 0.39%.

Market Direction Action Sep 20 2013

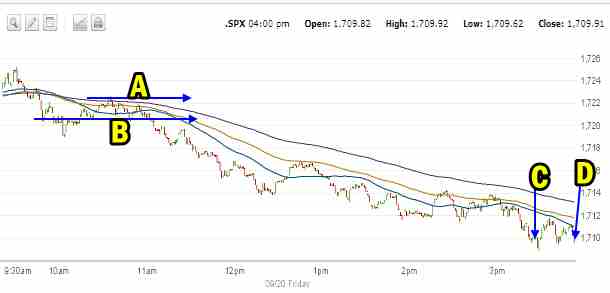
The intraday chart for Sep 20 is below, set for 1 minute. The problems actually got underway shortly after 11:00 AM when the market kept trying to break higher as you can see at point A and a bottom looked like it was set at point B. The inability to break higher started the selling. By 11:30 with the media buzzing about why the Fed had not commenced tapering in September started a lot of talk and investors, always nervous began to sell heavier.  Shortly before 1:00 the market tried a little rally which failed and the selling started in again. By point C as the market was drawing to a close some buyers were picking up small lots of shares but the little rally was pushed down twice by fearful investors and the S&P 500 closed near the lows for the day at point D.

Market Direction intraday Sep 20 2013

Advance Declines For Sep 20 2013

Friday’s advancing issues were at just 27% with declining issues commanding 71% of the volume. However new highs were 215 while new lows were 95. So despite the overwhelming negativity stocks still were making far more new highs than new lows.

Market Direction Closing For Sep 20 2013

The S&P 500 closed at 1,709.91 down 12.43 or down 0.72%. The Dow closed at 15,451.09 down 185.46 for the biggest lost among the indexes at 1.18%.  The NASDAQ closed at 3,774.73 down just 14.66.

Market Direction Technical Indicators At The Close of Sep 20 2013

Let’s review the market direction technical indicators at the close of Sep 20 2013 on the S&P 500 and view the market direction outlook for Sept 23 2013.

Market Direction Technical Analysis sep 20 2013

For Momentum I am using the 10 period. Momentum is positive and has pulled back from Thursday’s reading.

For MACD Histogram I am using the Fast Points set at 13, Slow Points at 26 and Smoothing at 9. MACD (Moving Averages Convergence / Divergence) issued a buy signal on Sep 9 which was confirmed on Sep 10. MACD pulled back from Thursday’s reading but is still a robust reading of 5.98.

The Ultimate Oscillator settings are Period 1 is 5, Period 2 is 10, Period 3 is 15, Factor 1 is 4, Factor 2 is 2 and Factor 3 is 1. These are not the default settings but are the settings I use with the S&P 500 chart set for 1 to 3 months.

The Ultimate Oscillator is no longer overbought and now pulling back.

Rate Of Change is set for a 21 period. The rate of change is also pulling back which reflects the lack of buying on Friday.

For the Slow Stochastic I use the K period of 14 and D period of 3. The Slow Stochastic is signaling that the market direction isdown. It is extremely overbought.

For the Fast Stochastic I use the K period of 20 and D period of 5. These are not default settings but settings I set for the 1 to 3 month S&P 500 chart when it is set for daily. The Fast Stochastic is extremely overbought and the signal for Friday was for a down day on Monday.

Market Direction Outlook And Strategy for Sept 23 2013

For Monday then I am expecting some weakness but also perhaps a pop in the morning after such a heavy sell-off on Friday. I am not expecting a rise in the market place but it would not be too surprising if it happened. Instead I think investors will be holding back waiting to see if there is buying and to what degree. This will give them a clue whether the market direction will fall lower or trend sideways here.

I believe market direction will trend more sideways than down or up as investors digest what happened on Friday. Overall though I think the damage from Friday was a direct result of Fed action on Wednesday which resulted in over enthusiasm by investors who over extended an already over extended market. Then comments on Friday by St. Louis Federal Reserve Bank President James Bullard regarding a possible tapering in October worried investors who sold the market direction lower.

This is typical investor behavior and we should see by Tuesday what market direction stocks in general are going to take.

Market Direction Internal Links

Profiting From Understanding Market Direction (Articles Index)

How I Use Market Timing

How I Use Market Timing

Understanding Short-Term Signals

Various Market Timing Systems

Market Direction Portfolio Trades (Members)

Market Direction External Links

Market Direction IWM ETF Russell 2000 Fund Info

Market Direction SPY ETF 500 Fund Info

Recent Outlooks

Stock Market Outlook For Thu May 7 2026 – Bullish and Still Higher

Prior Trading Day Summary On Wednesday stocks soared as strong earnings from Advanced Micro Devices Stock (AMD) sparked another rally. The SPX made another new intraday high as it reached 7369. The index closed up 106 points to end the …

Morning Investing Strategy Notes for Wed May 6 2026

For FullyInformed Members the morning Investing Strategy Notes for Wed May 6 2026 look at the rebound on Tuesday following Monday’s selling.. There are a large number of equities discussed in today’s morning Investing Strategy Notes. They include Palantir Tech …

Stock Market Outlook For Wed May 6 2026 – Choppy But Higher Still

Prior Trading Day Summary On Tuesday stocks again shook off Middle East worries and climbed higher. The SPX made another new intraday high as it reached 7273. The index closed up 58 points to end the day at 7259 on …

Morning Investing Strategy Notes for Tue May 5 2026

For FullyInformed Members the morning Investing Strategy Notes for Tue May 5 2026 look at the dip on Monday and the chance for another lower close today. There are a large number of equities discussed in today’s morning Investing Strategy …

Stock Market Outlook For Tue May 5 2026 – Overbought and Lower

Prior Trading Day Summary On Monday stocks saw some minor pressure and ended the day slightly lower. The SPX lost 29 points to close at 7200 on 5.2 billion shares traded. 63% of all stocks were falling by the close …

Morning Investing Strategy Notes for Mon May 4 2026

For FullyInformed Members the morning Investing Strategy Notes for Mon May 4 2026 look at the chance for a lower close. There are a large number of equities discussed in today’s morning Investing Strategy Notes. They include Palantir Tech Stock …

Stock Market Outlook For Mon May 4 2026 – Dips Likely With Possible Lower Close

Prior Trading Day Summary On Friday stocks continued to push higher on the back of better than estimated earnings from a number of large cap companies. With their stocks continuing to climb, stocks are once more extremely overbought. The SPX …

Morning Investing Strategy Notes for Fri May 1 2026

For FullyInformed Members the morning Investing Strategy Notes for Fri May 1 2026 look at the chance for another closing new high on Friday. There are a large number of equities discussed in today’s morning Investing Strategy Notes. They include …

Stock Market Outlook For Fri May 1 2026 – Overbought But Higher

Prior Trading Day Summary On Thursday earnings from a number of big cap stocks like Alphabet Stock (GOOGL) and Eli Lilly Stock (LLY) helped to push the indexes to new all-time highs yet again. The SPX rose 73 points to …

Morning Investing Strategy Notes for Thu Apr 30 2026

For FullyInformed Members the morning Investing Strategy Notes for Thu Apr 30 2026 look at the odds of a lower day. There are a large number of equities discussed in today’s morning Investing Strategy Notes. They include Alphabet Stock (GOOGL), …

Stock Market Outlook For Thu Apr 30 2026 – Dips Likely Possible Lower Close

Prior Trading Day Summary On Wednesday the SPX closed slightly lower while the NASDAQ closed higher ending the day with a mixed outlook. The SPX fell 3 points to close at 7135 on 5.2 billion shares traded. Just 37% of …

Morning Investing Strategy Notes for Wed Apr 29 2026

For FullyInformed Members the morning Investing Strategy Notes for Wed Apr 29 2026 look at expectations for profits on Wednesday and especially Thursday. There are a large number of equities discussed in today’s morning Investing Strategy Notes. They include Nucor …

Stock Market Outlook For Wed Apr 29 2026 – Choppy But Higher Ahead Of More Earnings

Prior Trading Day Summary On Tuesday both the SPX and NASDAQ lost a little ground but the bigger earnings are set to be released starting tomorrow. The SPX fell 35 points to close at 7178 on 5 billion shares traded …

Morning Investing Strategy Notes for Tue Apr 28 2026

For FullyInformed Members the morning Investing Strategy Notes for Tue Apr 28 2026 look at anticipated market action for today. There are a number of equities discussed in today’s morning Investing Strategy Notes. They include Intel Stock (INTC), Nucor Stock …

Subscribe For The Latest News