
The market direction outlook for Thursday was for the market to drift a bit sideways but continue the climb higher. The Dow had the most difficult time thanks in no small part to IBM which plunged on the news that revenue out of China slumped badly. This marked another quarter that IBM revenue dropped. More than 11 brokerages slashed their price targets lower. Volume was the highest IBM has seen since the crash of 08-09.
The Dow which plunged at the open, managed to climb back and close down just 2.18 points. Meanwhile though the S&P closed at a new all-time high of 1733.15. The NASDAQ followed suit rising 23.71 points to close at a new 13 year high. The Russell 2000 also set a new record closing up 0.88 percent to close at $109.44.
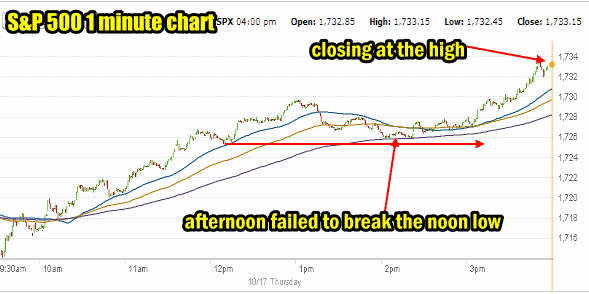
Market Direction S&P 500 Intraday For Oct 17 2013
The intraday 1 minute chart for the S&P 500 is interesting. From the morning open the S&P climbed higher. There was no morning dip today but instead over the lunch hour stocks moved slightly lower. After lunch buying continued and when around 2:00 PM the S&P 500 pulled back but failed to break the noon hour low, the market direction pushed higher right into the close. An impressive day considering how overbought the market direction up is on the S&P 500.
Weekly Initial Unemployment Insurance Claims
The Weekly Initial Unemployment Insurance Claims were out and as regular readers of my blog know I consider them to be one of the best market direction timing systems available. You can select this link to read all the different market timing systems that I have reviewed. Jobless claims were down slightly to 358,000 from a revised 373,000 from the previous week. The numbers are difficult right now as many are skewed by the government shutdown. Numbers may change a lot in the next few weeks with the government employees back at work.
Advance Declines For Oct 17 2013
With today’s advance we are now seeing very strong advance numbers. Today 81% of issues were advancing and only 17% were declining. 329 new 52 week highs were made today versus 77 new lows. Numbers like these are indicative of the market reaching very overbought status. While this is not a cause for a correction it is a cause for weakness to develop so keep that knowledge to the forefront of Put Selling trades because we may see more weakness next week after Friday’s options expiry. Wouldn’t that be nice!
Market Direction Closing For Oct 17 2013
The S&P 500 closed at 1,733.15 up 11.61 and into new record highs. The Dow closed at 15,371.65 down 2.18 but up from earlier losses that saw the Dow down triple points. The NASDAQ closed at 3,863.15 up 23.71 and setting another new 13 year high. IWM ETF closed up 0.88% setting another new high at $109.44.
Market Direction Technical Indicators At The Close of Oct 17 2013
Let’s review the market direction technical indicators at the close of Oct 17 2013 on the S&P 500 and view the market direction outlook for Oct 18 2013.
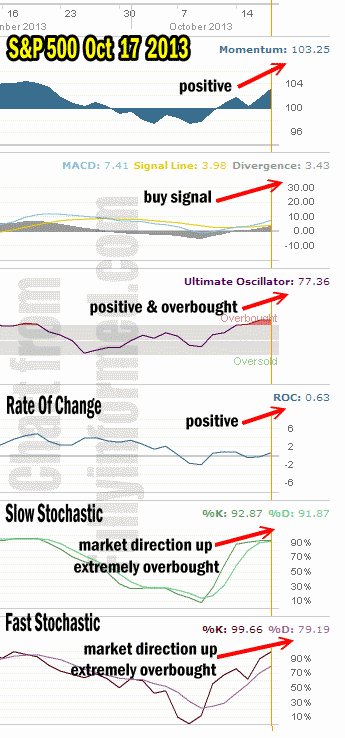
For Momentum I am using the 10 period. Momentum continued to push higher into positive territory. Momentum is still not at levels from the previous rally but it is getting stronger.
For MACD Histogram I am using the Fast Points set at 13, Slow Points at 26 and Smoothing at 9. MACD (Moving Averages Convergence / Divergence) issued a buy signal on Oct 14 and today the reading continues to climb. MACD has without a doubt been the best market timing indicator this year. No signal from MACD has been incorrect throughout 2013.
The Ultimate Oscillator settings are Period 1 is 5, Period 2 is 10, Period 3 is 15, Factor 1 is 4, Factor 2 is 2 and Factor 3 is 1. These are not the default settings but are the settings I use with the S&P 500 chart set for 1 to 3 months.
The Ultimate Oscillator is still overbought and indicates that more pressure to the upside continues to build.
Rate Of Change is set for a 21 period. The Rate Of Change turned positive today reflecting the change from the resolution passage by Congress last night. Investors are back buying.
For the Slow Stochastic I use the K period of 14 and D period of 3. The Slow Stochastic is signaling that the market direction is up but just barely. The reading are so close as to be almost neutral. This is reflecting that the Slow Stochastic is signaling that the start of next week could see some sideways action. The Slow Stochastic is extremely overbought.
For the Fast Stochastic I use the K period of 20 and D period of 5. These are not default settings but settings I set for the 1 to 3 month S&P 500 chart when it is set for daily. The Fast Stochastic is signaling that the market direction for tomorrow is also up and it is extremely overbought as well.
Market Direction Outlook And Strategy for Oct 18 2013
The market direction remains to the upside. The market direction technical indicators are reflecting that the market may move into a more neutral stance but the outlook remains positive for stocks. While the market set new highs today, we could see more new records shortly as investors remain buying stocks, particularly on dips.
My strategy has changed only slightly. I have started to commit to larger contract sizes again but I am staying selective and only picking stocks that I believe will be able to maintain their price levels. Recent sell-offs in stocks like YUM, Intel and Clorox are more opportunities than problems. The biggest concern at present continues to be the revenue picture from many companies. While many are showing decent revenue numbers, just as many are not. Last quarter was not nearly as strong as expected and this quarter looks somewhat similar again. This could be the biggest stumbling block to stocks pushing dramatically higher. Nonetheless stocks are being bought and my Put Selling continues unabated.
Tomorrow with Options expiring we could see some additional volatility but the sideways action is more what I think the market will see. If we don’t see it today I think we will at the start of next week. The market direction has to work out the overbought condition before it can move meaningfully higher. The bias though still remains to the upside for stocks.
Market Direction Internal Links
Profiting From Understanding Market Direction (Articles Index)
Understanding Short-Term Signals
Market Direction Portfolio Trades (Members)