

Prior Trading Day Summary
On Wed Jun 17 2026 comments from the new Fed Chair Warsh were perceived as hawkish by many investors. With bond yields rising in anticipation of a possible rate hike rather than a hoped for cut, investors decided to take some profits.
The SPX fell 91 points to close at 7420 but for the week the index is down just 11 points. Volume rose to 6.0 billion. By the close 71% of stocks were falling.
The NASDAQ lost 354 points to end the day at 26,021. For the week however the NASDAQ is still up 132 points.
Let’s review the closing technical indicators from Wed Jun 17 2026 to see what they predict for the final trading day of week, Thu Jun 18 2026.
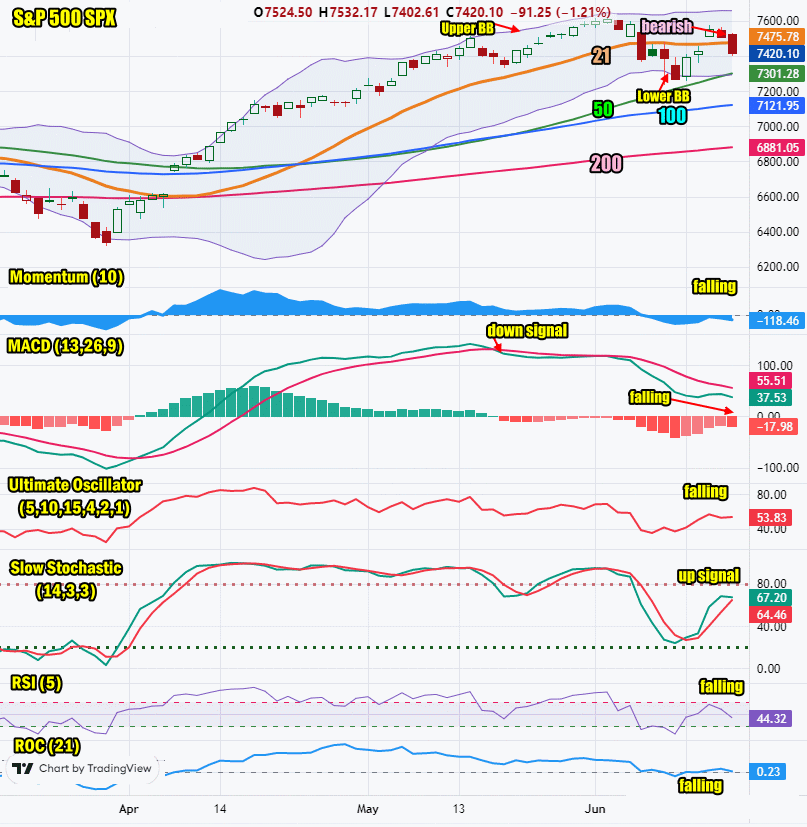
Stock Market Outlook: SPX Closing Chart For Wed Jun 17 2026
The index closed below the 21 day moving average. It was below the Upper Bollinger Band. This is bearish.
The closing candlestick is bearish for Thursday with the candlestick advising a bounce is likely but may not hold.
The 21 day moving average is rising and closed at 7475. This is bullish.
The 50 day moving average is rising and closed at 7301. This is bullish.
The 100 day moving average is rising and closed at 7121. This is bullish.
The 200 day moving average is rising and closed at 6881. This is bullish.
The Lower Bollinger Band is falling and is below the 50 day moving average. This is bullish at present. The Upper Bollinger Band is sideways which is neutral.
The SPX chart is more bullish than bearish for Thu Jun 18 2026 but bearish signs are increasing.
SPX Stock Market Outlook review of Wed Jun 17 2026
Stock Market Outlook: Technical Indicators Review
Momentum: Momentum is falling and negative. This is bearish.
|
MACD Histogram: MACD (Moving Averages Convergence / Divergence) issued a down signal on Tue May 19 2026. On Wed Jun 17 2026 the down signal gained strength.
|
Ultimate Oscillator: The Ultimate Oscillator is falling which is bearish.
|
Slow Stochastic: The Slow Stochastic has an up signal in place but could turn to a down signal today. This is bearish.
|
Relative Strength Index: The RSI signal is falling and bearish.
|
| Rate of Change: The rate of change is falling, signaling today will end lower. Settings: Rate Of Change is set for a 21 period. This indicator looks back 21 days and compares price action from the past to the present. With the Rate Of Change, prices are rising when signals are positive. Conversely, prices are falling when signals are negative. As an advance rises, the Rate Of Change signal should also rise higher, otherwise the rally is suspect. A decline should see the Rate Of Change fall into negative signals. The more negative the signals the stronger the decline. |
Stock Market Outlook: Support and Resistance Levels |
| 7600 is resistance |
| 7590 is resistance |
| 7570 is resistance |
| 7550 is resistance |
| 7500 is resistance |
| 7450 is resistance |
| 7425 is resistance |
| 7400 is resistance |
| 7370 is resistance |
| 7350 is resistance |
| 7300 is support |
| 7280 is support |
| 7250 is support |
| 7200 is support |
| 7175 is support |
| 7150 is support |
| 7125 is support |
| 7100 is good support |
| 7050 is good support |
| 7000 is stronger support |
Stock Market Outlook for Thu Jun 18 2026
Comments from the new Fed Chair seem to point to a potential rate hike this fall. With bond yields rising as a result, stocks may try a bounce today after yesterday’s drop, but weakness is growing. Despite this the SPX has a good chance to end the day higher. The economic indicators on Wednesday were well above estimates which showed the consumer is resilient and the economy stronger than estimated.
Potential Economic and Political Market Moving Events
Monday:
8:30 Empire State manufacturing survey for Juneplunged to 5.7 from 19.8 prior
9:15 Industrial production for May plunged to 0.1% from 0.9% prior
10:00 Home builder confidence for June slipped to 35 from 37 prior.
Tuesday:
8:30 May import price index is estimated to fall to 0.8% from 1.9% prior
8:30 Housing starts for May are estimated to have fallen to 1.41 million from 1.47 million prior
8:30 Building permits for May are estimated to have fallen to 1.42 million from 1.44 million prior
Wednesday:
8:30 Retail sales for May jumped to 0.9% which was higher than estimated
10:00 Pending home sales for May jumped 3.8% which was well ahead of estimates
2:00 Fed decision on interest rates is released
2:30 Fed news conference
Thursday:
8:30 Weekly Initial Unemployment Insurance Claims are estimated to jump to 225,000
10:00 Leading indicators for May are estimated unchanged at 0.1%