
FullyInformed.com
Generic filters

Market Direction Outlook For Nov 11 2013 – No Confirmation

Nov 10, 2013 | Stock Market Outlook

The market direction outlook for Monday will be a bit shorter as I am away at a conference until late Sunday night. Friday certainly did not follow my outlook for the market direction to continue lower. The employment news was better than expected and at first glance investors were concerned about the Federal Reserve tapering in December and they did not immediately jump back into stocks.

Shortly though investors saw that many of the gains were made in part-time employment and not the more important full-time positions. Investors jumped back in then and commenced to buy stocks pushing the Dow into record territory. The S&P had a terrific day as well but it did not make a new high.

Market Direction S&P 500 Intraday For Nov 8 2013

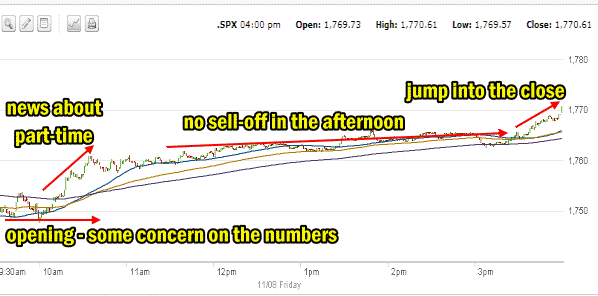
The intraday one minute chart below shows the market direction action for Nov 8. The opening saw concern among investors and they couldn’t decide what the employment numbers held for the Fed scaling back of existing Quantitative Easing program. By 10:00 the news on the part-time numbers hit the market and investors were buoyed by the outlook that the Fed would probably not scale back at least until after the debt ceiling was again resolved sometime in early 2014. There was no sell-off in the afternoon which again emboldened investors and the last half hour saw new buying come into the market place, jumping the index into the close.
Market Direction Nov 8 2013

Advance Declines For Nov 8 2013

Advancing issues outpaced decliners but only by a small margin. Advancing issues were 56% and deceivers came in at 42%. New highs were worse with only 118 new highs versus q112 new lows.

Market Direction Closing For Nov 8 2013

The S&P 500 closed at 1,770.61 up 23.46. The Dow closed at 15,761.78 up 167.80. The NASDAQ closed at 3,919.23 up 61.90.  The IWM ETF was up 1.82% to 109.23.

Market Direction Technical Indicators At The Close of Nov 8 2013

Let’s review the market direction technical indicators at the close of Nov 8 2013 on the S&P 500 and view the market direction outlook for Nov 11 2013.
Market Direction Technical Analysis Nov 8 2013

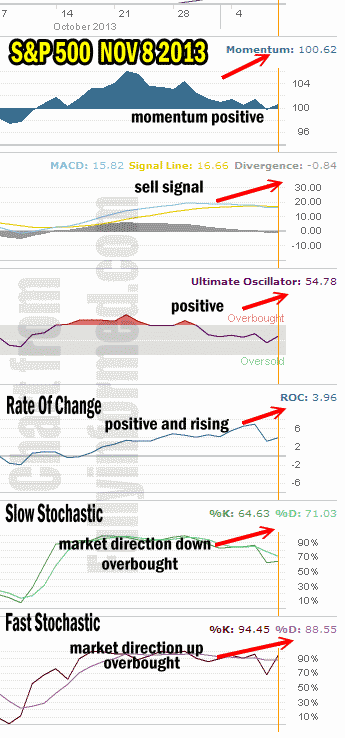
For Momentum I am using the 10 period. Momentum is back positive on Friday.

For MACD Histogram I am using the Fast Points set at 13, Slow Points at 26 and Smoothing at 9. MACD (Moving Averages Convergence / Divergence) issued a sell signal on Nov 7, but it was not confirmed by a lower sell signal on Friday. We will have to wait until Monday to see if there is a confirmation of Thursday’s strong sell signal.

The Ultimate Oscillator settings are Period 1 is 5, Period 2 is 10, Period 3 is 15, Factor 1 is 4, Factor 2 is 2 and Factor 3 is 1. These are not the default settings but are the settings I use with the S&P 500 chart set for 1 to 3 months.

The Ultimate Oscillator is positive and rising.

Rate Of Change is set for a 21 period. The Rate Of Change moved sideways on Friday with a slight move higher.

For the Slow Stochastic I use the K period of 14 and D period of 3.  The Slow Stochastic is signaling that the market direction is down. It is overbought.

For the Fast Stochastic I use the K period of 20 and D period of 5. These are not default settings but settings I set for the 1 to 3 month S&P 500 chart when it is set for daily. The Fast Stochastic is signaling that the market direction is up for Monday and it is extremely overbought after Friday’s big push higher.

Market Direction Outlook And Strategy for Nov 11 2013

The move high was somewhat unexpected until I saw the part-time positions. That coupled with the fact that December tapering by the Fed would mean scaling back stimulus right as the new year starts with the debt ceiling issue again was enough to get investors back buying again. This year has seen a tremendous amount of capital put back to work in stocks. That is helping to keep stocks elevated and moving higher.

For Friday the majority of the technical indicators point to a higher market. The fact that the MACD sell signal was not confirmed on Friday could be pointing to a false sell signal from Thursday and the next move could be back higher.

Myself, looking at the market and the technical readings it would seem that up has a stronger bias than down. The advance decline ratio though is not indicative of a run away move higher and if anything points to more weakness. Therefore I will not be surprised if we have some selling on Monday but the general move should remain to the upside so any selling should end on Monday and we should see a higher close even if just marginally.

Market Direction Internal Links

Profiting From Understanding Market Direction (Articles Index)

How I Use Market Timing

How I Use Market Timing

Understanding Short-Term Signals

Various Market Timing Systems

Market Direction Portfolio Trades (Members)

Market Direction External Links

Market Direction IWM ETF Russell 2000 Fund Info

Market Direction SPY ETF 500 Fund Info

Recent Outlooks

Stock Market Outlook For Fri Aug 21 2026 – Unconfirmed MACD Down Signal

Prior Trading Day Summary On Thu Aug 20 2026 stocks moved lower as bond yields rose again despite the efforts of Treasury Secretary Bessent to calm bond markets.  days is anyone’s guess. The SPX ended the day down 66 points …

Morning Investing Strategy Notes for Thu Aug 20 2026

For FullyInformed Members the morning Investing Strategy Notes for Thu Aug 20 2026 discuss the outlook for stocks after Wednesday’s slightly higher close. There are a number of equity trades today. Stocks include Nordson Corp Stock (NDSN), Walmart Stock (WMT), …

Stock Market Outlook For Thu Aug 20 2026 – Bounce Likely But Weakness Continues

Prior Trading Day Summary On Wed Aug 19 2026 stocks regained their footing when Treasury Secretary Bessent announced doubling long-bond buybacks to try to stop rising bond rates. For the day it worked and bond yields dipped lower but whether …

Morning Investing Strategy Notes for Wed Aug 19 2026

For FullyInformed Members the morning Investing Strategy Notes for Wed Aug 19 2026 discuss the outlook for stocks after two days of losses. There are a number of equity trades today. Stocks include Toll Brothers Stock (TOL), Wells Fargo Stock …

Stock Market Outlook For Wed Aug 19 2026 – Weakness and Lower – FOMC Minutes

Prior Trading Day Summary On Tue Aug 18 2026 with oil prices rising and bond yields rising to level not seen in two decades, stocks couldn’t hold their recent gains. The SPX ended the day down 53 points to close …

Morning Investing Strategy Notes for Tue Aug 18 2026

For FullyInformed Members the morning Investing Strategy Notes for Tue Aug 18 2026 discuss the outlook for stocks following a second down day on Monday. There are a number of equity trades today. Stocks include Wells Fargo Stock (WFC), SMH …

Stock Market Outlook For Tue Aug 18 2026 – Weakness With Dips

Prior Trading Day Summary On Mon Aug 17 2026 stock indexes ended the day slightly lower as investors attention returned to the Iran conflict and rising bond yields. The SPX ended the day down 40 points to close at 7745 …

Morning Investing Strategy Notes for Mon Aug 17 2026

For FullyInformed Members the morning Investing Strategy Notes for Mon Aug 17 2026 discuss the prior week and the outlook for the third week of August for equities. There are a number of equity trades today. Stocks include Home Depot …

Stock Market Outlook For Mon Aug 17 2026 – Dips Likely But Higher Close

Prior Trading Day Summary On Fri Aug 14 2026 the stocks saw further weakness with both the S&P and NASDAQ ending in the red. The SPX ended the day down 18 points to close at 7780. Intraday the SPX saw …

Morning Investing Strategy Notes for Fri Aug 14 2026

For FullyInformed Members the morning Investing Strategy Notes for Fri Aug 14 2026 review the rally on Thursday. There are a number of equity trades today. Stocks include Netflix Stock (NFLX), Western Digital Stock (WDC), International Business Machines Stock (IBM) …

Stock Market Outlook For Fri Aug 14 2026 – Bullish – New Highs

Prior Trading Day Summary On Thu Aug 13 2026 the July PPI numbers came in more “tame” than many analysts were predicting. Stocks moved higher as a result. The SPX ended the day up 50 points to close at 7798, …

Morning Investing Strategy Notes for Thu Aug 13 2026

For FullyInformed Members the morning Investing Strategy Notes for Thu Aug 13 2026 review the market action on Wednesday. There are a number of equity trades today. Stocks include ARM Stock (ARM), Cisco Stock (CSCO), Tapestry Inc Stock (TPR), Applied …

Stock Market Outlook For Thu Aug 13 2026 – Mixed Outlook For Second Day Ahead Of PPI Numbers

Prior Trading Day Summary On Wed Aug 12 2026 the July CPI numbers came in as estimated but did not show inflation is taking off. Stocks tried to rally off the news but with the latest PPI numbers due of …

Morning Investing Strategy Notes for Wed Aug 12 2026

For FullyInformed Members the morning Investing Strategy Notes for Wed Aug 12 2026 review the outlook for Wed Aug 12 2026 with the release of the July CPI numbers. There are a number of equity trades today. Stocks include Coreweave …

Subscribe For The Latest News