The market direction outlook for Monday was for stocks to move lower but as I explained “The market direction is down for Monday but remember, the markets could surprise either way as two catalysts should show us which way stocks will move next – the Crimea and the Federal Reserve.”
As explained in my morning comments, there were not two, but four catalysts for stocks today. You can review the morning comments here. Another catalyst to the upside is also the large number of short-sellers who are short the market. With media articles flooding investors with predictions of doom and gloom for stocks, a lot of investors are short. A day like today scares those shorts and a lot of them, even the experienced traders tend to cover positions. This drives the market direction even higher. Let’s look at today’s market direction action.
S&P Market Direction Intraday for March 17 2014
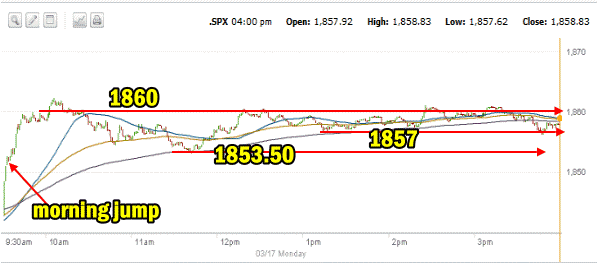
The one minute intraday S&P chart below shows today’s action. While Friday didn’t look very convincing for a move higher, today’s jump may be more “technical” and “catalyst” than a full change in trend. The morning jump eventually took the market to above 1860. From there it fell until 11:30 when it reached around the 1853.50 level. With the market not moving much lower a lot of buying emerged which many analysts contend was short covering as this was the only large dip for the day. If this was the case, the S&P managed to push to 1857 which was held for much of the afternoon and shortly after 2:00 investors pushed again to try to break 1860. This failed and the market drifted back to 1857 until the close when it jumped to 1858.83.

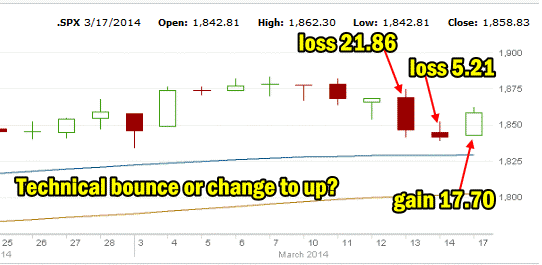
Today’s movement is typical of a technical bounce except that the bounce was better than 50% of the losses from Thursday and Friday so there was some conviction among some investors that this was another buying opportunity. To be fair, 2013 had a number of these small dips and many of those were shorted by investors who seemed pretty determined that the market was going to fall apart. They were wrong in 2013 and perhaps they are wrong here again.
Technical Bounce or Change To Up?
Last week the S&P lost 27.07 points. A technical bounce normally will recover about 50% of the previous loss. As I had expected Friday to see a bit of a better bounce, I added in Friday’s loss with Thursday’s. Even added together today’s bounce of 17.70 reclaimed 65% of the loss and if taken against Thursday’s plunge it recovered 80% of the loss. These are strong numbers and point to investors actually buying stock and not just trading.

While we could definitely see a lower day tomorrow especially if Putin makes another move on the Crimea, the most important level today was 1851 which was the first morning bounce back. In my morning comments I mentioned that 1851 was important for the market to close at or above for the day. The market did that with ease. Meanwhile the 1840 level on Friday certainly seemed to hold and as mention in my market direction comments last night, a lot of investors may be drawn back in if the 1840 level appears to have held. So while we will probably see some weakness after today’s rally, the 1840 level looks pretty decent which means I will be continuing to place capital at risk through more trades even if stocks turn back to weakness after today.
Advance Declines For March 17 2014
Friday had marked the first day in weeks, where we saw more 52 week new lows than 52 week new highs. Today the market again had more new highs than new lows. 70% of stocks were advancing and 27% were declining. 123 new highs were made and 72 new lows. The momentum today was all one-sided.
Market Direction Closings For March 17 2014
The S&P closed at 1858.83 up 17.70. The Dow closed at 16,247.22 up 181.55. The NASDAQ closed at 4279.95 up 34.55
The Russell 2000 ETF IWM matched the gain from Friday and moved up another 0.44% to 118.06 but the big gains came from the other three indexes. Often this tells investors that quite a bit of today’s jump in the big indexes was short covering. The Russell 2000 is shorted less often.
Market Direction Technical Indicators At The Close of March 17 2014
Let’s review the market direction technical indicators at the close of March 17 2014 on the S&P 500 and view the market direction outlook for March 18 2014.

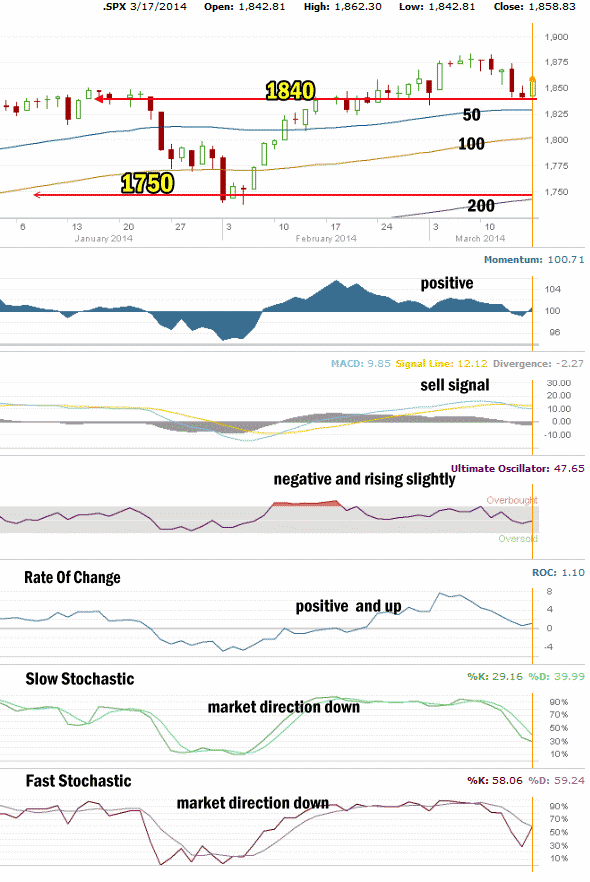
The 1750 level has been holding the S&P up and now the 1840 level becomes the first line of support. The bounce back today whether just technical with a lot of short covering or not, does not matter for the 1840 level. It withheld selling pressure for 2 days and saw the market bounce up from there. 1840 then becomes the first serious support level for a move higher.
For Momentum I am using the 10 period. Momentum has been the best indicator over the past three months, replacing MACD as the most accurate indicator. Momentum rose slightly today but is back positive. It was negative for just two days.
For MACD Histogram I am using the Fast Points set at 13, Slow Points at 26 and Smoothing at 9. MACD (Moving Averages Convergence / Divergence) issued a sell signal on Feb 13. MACD continued to decline today despite the move higher in the S&P.
The Ultimate Oscillator settings are Period 1 is 5, Period 2 is 10, Period 3 is 15, Factor 1 is 4, Factor 2 is 2 and Factor 3 is 1. These are not the default settings but are the settings I use with the S&P 500 chart set for 1 to 3 months.
The Ultimate Oscillator is negative but did turn back up. Still though it would be hoped that today’s big jump would have pushed the Ultimate Oscillator into a slightly positive reading. This did not happen.
Rate Of Change is set for a 21 period. The rate of change is still positive and turned back up today indicating some buying conviction among some investors.
For the Slow Stochastic I use the K period of 14 and D period of 3. The Slow Stochastic is signaling that the market direction is still down despite today’s jump higher. This could change tomorrow but for now it would seem to indicate a lot of today’s bounce was technical.
For the Fast Stochastic I use the K period of 20 and D period of 5. These are not default settings but settings I set for the 1 to 3 month S&P 500 chart when it is set for daily. The Fast Stochastic is signaling that the market direction is also down for tomorrow but the readings are close enough that we could say it is more neutral than down for Tuesday. Both the Slow Stochastic and the Fast Stochastic are no longer oversold.
Market Direction Outlook And Strategy for March 18 2014
We had a number of catalysts hit the markets all at the same time. This along with an oversold environment and short covering helped to create a bounce. The bounce was greater than normal and may seem to point to a change from down to either sideways to up. There are a lot of factors coming into play this week and the Crimea is certainly front and center but so is the Federal Reserve. This could be a very choppy week, which is what I love for my option premiums to stay high.
For tomorrow the market direction technical indicators are split with two pointing definitely lower, two point back to up and two pointing neutral. Normally this type of outlook leads to a sideways day with a bias in either direction. This means a mixed outlook for Tuesday. The question for Tuesday will be whether there is enough momentum to the upside to confirm today’s change with another up day on Tuesday. That would go a long way to giving investors a clearer signal on where the market direction is heading.
The most important aspect for my investing is that the market direction even sideways is fine for my strategies but today’s market direction action shows that the chance of a larger decline in stocks is greatly reduced with today’s move higher and that means continuing to stay invested is the right course for me to be taking. Tomorrow then the market direction outlook is mixed.
Market Direction Internal Links
Profiting From Understanding Market Direction (Articles Index)
Understanding Short-Term Signals
Market Direction Portfolio Trades (Members)
Market Direction External Links
Market Direction IWM ETF Russell 2000 Fund Info
Market Direction SPY ETF 500 Fund Info
