
At one point today the S&P moved lower and reached 2004.17 but that seemed to bring in buyers. The low volume also made it easier for stocks to move both up and down on Tuesday but in general there seemed to be a tone of a lack of fear despite Monday’s sell-off. It seemed that the last half hour of trading on Monday where markets climbed back from their lows, carried through to today as many investors were picking through yesterday’s carnage, looking for “deals”.
Advance Decline Numbers
Volume on Tuesday was light at just 3.65 billion shares traded. Volume was almost equally balanced with 50% to the upside by the close and 47% to the downside. New lows by the close were down to 90 and new highs were up to 34. 57% of all stocks on New York were advancing by the close.
Market Indexes Closing Numbers
All indexes closed relatively flat. The S&P closed at 2,016.71 up 4.05. The Dow Jones closed at 17,158.66 up 9.72. The NASDAQ closed at 4891.43 down 11.66.
Market Direction Technical Indicators At The Close
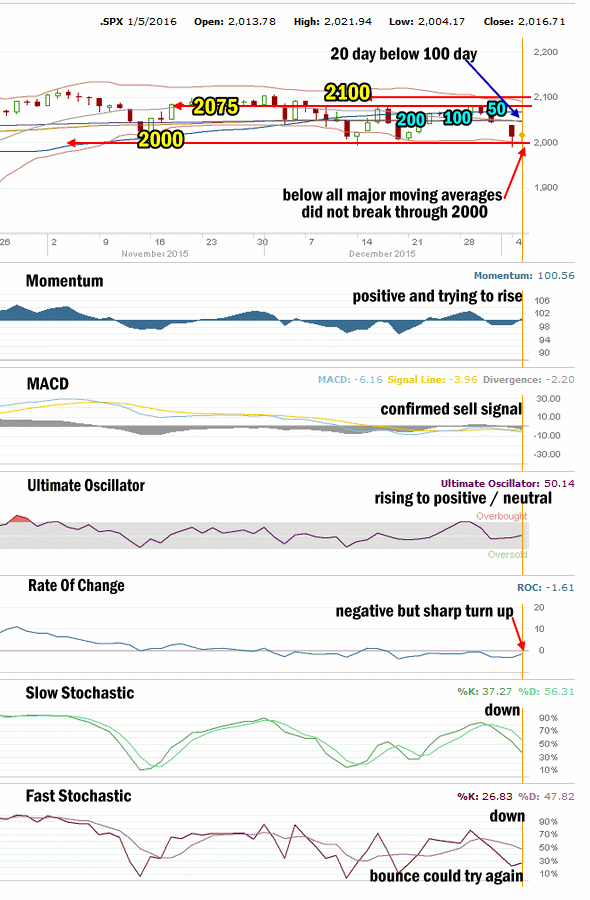
SPX Market Direction Technical Analysis for Jan 5 2016
Stock Chart Comments:
The second trading day of 2016 saw the market trade in a range from 2020 to 2007 with breaks to 2004.17 on the downside and 2021.94 to the upside. The dip down toward 2000 brought in buyers who seemed reluctant to wait to see if the S&P would break below 2000 as it had done on Monday. The close was only slightly positive at 2016.71 but considering that numerous times the S&P moved to retest 2007, the close was actually more positive than it might at first appear.
The 20 day simple moving average (SMA) continued its declined however and broke below the 100 day moving average. It is now falling quickly below all three major moving averages. The 50 day is continuing to lead the market but the 200 day is still leading the 100 day and showing no signs of changing.
Support and Resistance Levels:
These are the present support and resistance levels. These levels have not changed since January 2015. That is unusual for the stock market and is the first time since I started investing in the early 1970′s that the same support levels have been referred to for what is now more than an entire year.
2100 was light support. Stocks have been unable to stay above this level. It remains resistance.
2075 was light support. Below that is 2050 which was also light support. Stronger support is at 2000 which had repeatedly held the market up throughout each pullback in January and February but failed under the waves of selling in the last correction in August and September. Stocks continue to have trouble holding above the 2000 level since the August 2015 correction.
Weak support is at 1970 while stronger support is at 1956 and technically it is more important than 1970 for the market. 1940 is light support. 1920 is light support. 1900 is more symbolic than anything else.
1870 and 1840 are both levels with strong enough support to delay the market falling and should see a sideways action attempt while investors decide whether to sell or buy. So far 1870 has held the market up better than any of the other support levels aside from 2000 which held the market up for months before the collapse in August 2015.
The other two support levels are 1775 and 1750. I have explained that these two are critical support for the present bull market. While 1775 is important it is 1750 that is the bottom line.
A break of 1750 would mark a severe correction from the all-time high of 2134.72. This would be the biggest correction since April 2012. A pull-back of that size would definitely stun investors and bring to question whether the bull market is finished.
Momentum: For momentum I use a 10 period when studying market direction. Momentum had turned negative last Thursday for the final trading day of 2015 but today it pushed back to slightly positive.
MACD Histogram: For MACD Histogram, I am using the Fast Points set at 13, Slow Points at 26 and Smoothing at 9. MACD (Moving Averages Convergence / Divergence) issued a sell signal on Jan 4. That sell signal was confirmed today. This ends the buy signal which was on Dec 28 and was one of the shorter buy signals in over a year.
Ultimate Oscillator: The Ultimate Oscillator settings are: Period 1 is 5, Period 2 is 10, Period 3 is 15, Factor 1 is 4, Factor 2 is 2 and Factor 3 is 1. These are not the default settings but are the settings I use with the S&P 500 chart set for 1 to 3 months. The Ultimate Oscillator rose today and moved back to a neutral or slightly positive reading.
Rate of Change: Rate Of Change is set for a 21 period. The rate of change signal is negative but took a sharp turn higher today.
Slow Stochastic: For the Slow Stochastic I use the K period of 14 and D period of 3. The Slow Stochastic tries to predict the market direction further out than just one day. The Slow Stochastic is signaling lower for stocks.
Fast Stochastic: For the Fast Stochastic I use the K period of 20 and D period of 5. These are not default settings but settings I set for the 1 to 3 month S&P 500 chart when it is set for daily. The Fast Stochastic is also pointing lower but took a sharp turn up and while not deeply oversold, it is oversold enough that the market might try for a second rally on Wednesday.
Market Direction Outlook for Jan 6 2016
With the lack of a Santa Claus rally behind us, January looks glum but today’s action which was a see-saw between negative and positive was still strong enough to show that investors are unwilling to “throw in the towel” following yesterday’s big drop. Technically the indicators are 4 to 2 negative. Unfortunately we have seen this type of action before the day after a big drop. The market instead of bouncing back, moves sideways which often sets it up for another pullback day.
Tomorrow then could see a mixed day. Another rebound attempt might be tried but overall the market looks poor especially after hours with Saudi Arabia announcing further oil price cuts to step up its “attack” on Iran’s re-entry into the oil markets. As well Tuesday’s action was poor for many of the market leaders including Disney which dropped 2.02% and is nearing support levels at $100, Apple which was down 2.51% at 102.71 showing an inability to hold the $105 support level once again, Netflix down 2.09%, and Priceline down 2.78%. As well, during the day on Tuesday the Dow Jones Industrial Transport Index reached the lowest level since February 2014 Intraday. All of these point to the possibility of further declines this week.
For Wednesday then watch for a possible bounce but overall the outlook is still lower until we get some back to back rally days.
Stay FullyInformed With Email Updates
Market Direction Internal Links
Profiting From Understanding Market Direction (Articles Index)
Understanding Short-Term Signals
Market Direction Portfolio Trades (Members)
Market Direction External Links
IWM ETF Russell 2000 Fund Info
Market Direction SPY ETF 500 Fund Info