
The outlook for Monday for stocks was for a gap up open and then some weakness but a push to try to move higher. Even the conflict in Libya could not turn the tide on oil and more analysts are now calling for oil to fall to possibly as low as $40 before it finds a bottom. For contrarians does this mean oil is getting close to a bottom? We will find out soon enough I suspect. I am not an oil analysts so my predictions are of limited value but I felt for a long time that oil was overvalued and should pullback to at least $60 to $65. It took most of this year for oil to get that low. Personally I also think gold is overvalued and I am expecting it to fall further in 2015 but once again I am not a gold analyst. I look more at markets and demand and right now demand for oil and gold are continuing to decline.
SPX Intraday Chart
The one minute intraday chart for today, Dec 29 2014, shows the morning gap up and then a sideways pattern which at the end of the day brought the index back to the first top in the morning gap open. This is more a sign of an overbought market than a market ready to fall. It is typical as well for a market setting new highs under heavily overbought conditions.
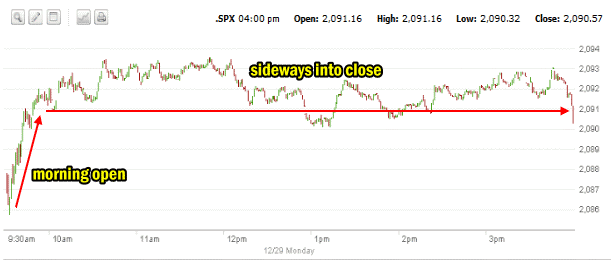
SPX Intraday chart for Dec 29 2014
Advance Decline for Dec 29 2014
Volume today picked up reaching 2.4 billion shares. 59% of all volume was to the upside with 240 new highs but also a slight rise in new lows to 37. New highs need to get back up over 300 to support a lot more upside to the rally, especially if investors are going to see larger gains to the upside each day, rather than a slow grind higher.
Market Direction Closings For Dec 29 2014
The S&P closed at 2,090.57 up 1.80. The Dow closed at 18,038.23 up 15.48. The NASDAQ closed at 4,806.91 up 0.05.
Market Direction Technical Indicators At The Close of Dec 29 2014
Let’s review the market direction technical indicators at the close of Dec 29 2014 on the S&P 500 and view the market direction outlook for Dec 30 2014.
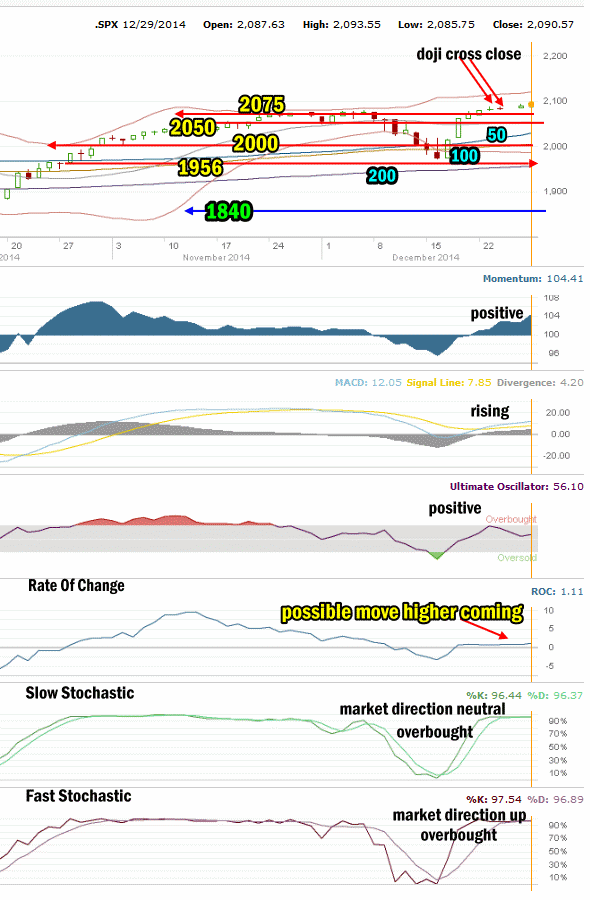
Market Direction Technical Analysis for Dec 29 2014
Stock Chart Comments: I mentioned yesterday how last week, on Tuesday and Wednesday doji-cross candlesticks were seen at the close, which often indicate indecision and a stalling or pullback in a rally. On Friday and again today the markets tried to break free of the overbought condition but were unable to do so. Today’s sideways market plays in well with what the doji-cross candlesticks were telling us. Today was more a consolidation day and stocks do appear ready to try to move higher. This could be the end of the doji-cross effect from last week.
The 50 day simple moving average (SMA) is continuing to push higher breaking away from the tight sideways trend between it and the 100 day EMA from the last couple of weeks. This again points to stocks ready to break higher.
Support Levels:
2075 has very light support. Below 2050 is strong support at 2000 and weak support at 1970. Stronger support is then at 1956. 1870 and 1840 are both levels with strong enough support to delay the market falling.
The other two support levels are 1775 and 1750. I have explained that these two are critical support for the present bull market. While 1775 is important it is 1750 that is the bottom line.
A break of 1750 would mark a severe correction from the most recent high. This would be the biggest correction since April 2012. A pull-back of that size would definitely stun investors at this point and it is not something I am anticipating at this time.
Momentum: For Momentum I am using the 10 period. Momentum is positive and moving higher. It is not as strong as in previous rallies.
MACD Histogram: For MACD Histogram, I am using the Fast Points set at 13, Slow Points at 26 and Smoothing at 9. MACD (Moving Averages Convergence / Divergence) issued a buy signal Dec 22. It continues to rise in readings which also supports the market outlook of stocks moving higher.
Ultimate Oscillator: The Ultimate Oscillator settings are: Period 1 is 5, Period 2 is 10, Period 3 is 15, Factor 1 is 4, Factor 2 is 2 and Factor 3 is 1. These are not the default settings but are the settings I use with the S&P 500 chart set for 1 to 3 months. The Ultimate Oscillator is positive.
Rate of Change: Rate Of Change is set for a 21 period. The Rate Of Change is positive but continues to trend sideways although today’s reading is slightly higher than Friday’s indicating more upside to the trend.
Slow Stochastic: For the Slow Stochastic I use the K period of 14 and D period of 3. The Slow Stochastic tries to predict the market direction further out than just one day. The Slow Stochastic is signaling market direction is neutral and it is very overbought.
Fast Stochastic: For the Fast Stochastic I use the K period of 20 and D period of 5. These are not default settings but settings I set for the 1 to 3 month S&P 500 chart when it is set for daily. The Fast Stochastic is signaling a move up for stocks again on Monday but the signal is almost neutral and it too is very overbought.
Market Direction Outlook and Strategy for Dec 30 2014
The overbought nature of the market is keeping stocks under wraps for the past several days. The market is trying to inch its way higher but some of the big gains from last week have to be consolidated. After moving more sideways than up for the past few sessions, the market may have consolidated enough to try once more for a higher close.
Technically the indicators are supporting more strength to the rally as most indicators are continuing to rise.
With just a couple more days to go before the end of the year, the Santa Claus rally normally lasts into the start of January. The advance decline numbers need to get over 300 for new highs and build on that number to really get the rally pushing still higher. Instead we are seeing the new highs stall out as the market direction trends sideways. This must be watched. A decline in the new highs will indicate trouble with the rally as the year ends.
The outlook for later this week is tough to predict but for Tuesday indications are, stocks want to push higher despite being very overbought.
Stay FullyInformed With Email Updates
Market Direction Internal Links
Profiting From Understanding Market Direction (Articles Index)
Understanding Short-Term Signals
Market Direction Portfolio Trades (Members)