
The market direction outlook for Monday was for stocks to continue to rally higher. The rally on Friday was anemic at best and did not reflect the extreme oversold condition following two days of heavy selling. While Friday had been lower there had also been many signals that a large rebound rally was coming and we got that rally on Tuesday once investors recovered from the bailout of Lisbon’s Banco Expirito Santo. The bailout caught investors by surprise as most had though the banking crisis was behind them.
As well fighting continued in the Gaza region and the Ukrainian problem certainly has not gone away. Add in Argentina, interest rate worries and rising wages and you can’t blame investors for being nervous.
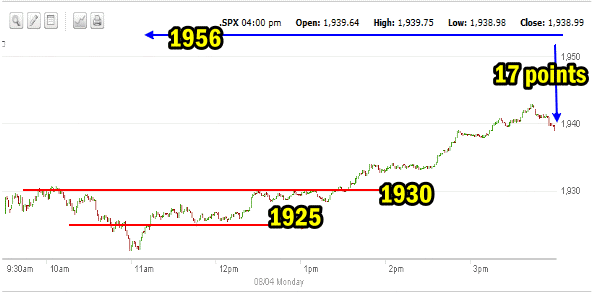
Market Direction S&P Intraday Chart August 4 2014
The one minute intraday chart for the SPX for August 4 shows two support levels and 1 pivot point at 1925. The morning saw the market unable to break through the 1930 level. There was too much uncertainty following the European problems, Gaza, the Ukraine and interest rate jitters. This kept the market below 1930. As the morning wore on and the S&P was unable to break through 1930, it sold lower and broke through 1925. While not overly significant and not a support point, 1925 was a pivot point for stocks. When 1925 broke, selling volume increased but then when the market got down to around 1921, investors stepped in and started to buy stocks again. The market pushed up to 1925 and then part way through the lunch hour, it pushed to 1930. For about an hour the S&P trended sideways unable to break through 1930. Around 1:30 a break came and the S&P pushed above 1930, held above it and then pushed still higher until as the close approached the S&P was above 1940. The last few minutes saw some selling and the S&P closed down 1 point shy of 1939.
The 1956 level is now just 17 points away from where the markets closed on Monday. A break back above 1956 either Tuesday or Wednesday would set the market up to push higher still.
Advance Declines For August 4 2014
Monday’s volume was low at just 3 billion shares but 69% of the volume was up. Meanwhile only 29 new highs were made while there were 70 new lows. Still though the strength was with the bulls, but it is important for the market to regain more than 150 new highs daily, to confirm the market direction up, otherwise this is just a recovery bounce before there is more selling.
Market Direction Closings For August 4 2014
The S&P closed at 1938.99 ip 13.84. The Dow closed at 16,569.28 up 75.91. The NASDAQ closed at 4383.89 up 31.25.
The Russell 2000 IWM ETF closed up 98 cents for a gain of 0.89% to close at 111.88.
Market Direction Technical Indicators At The Close of August 4 2014
Let’s review the market direction technical indicators at the close of August 4 2014 on the S&P 500 and view the market direction outlook for August 5 2014.
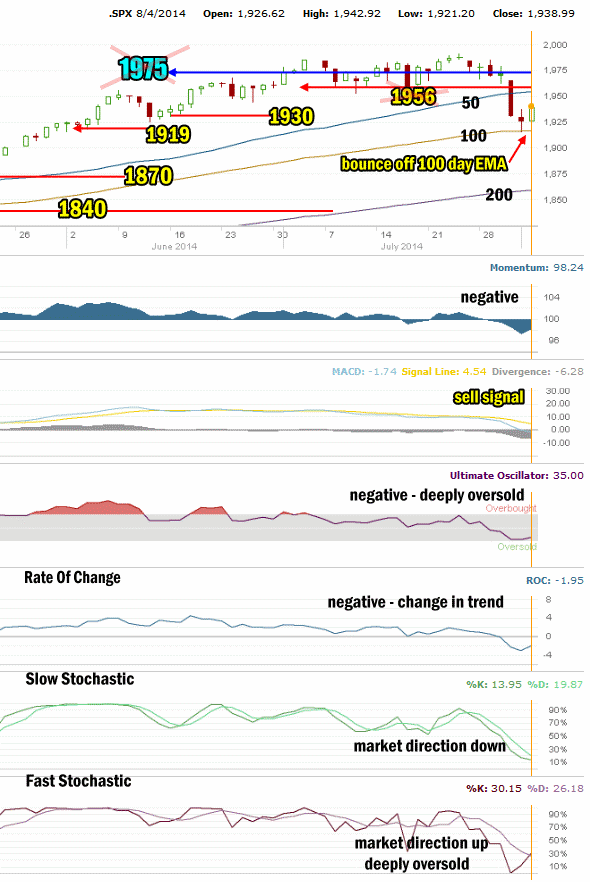
Stock Chart Comments: Stocks today continued to move away from the 100 day EMA. While a good sign, there must be additional follow through with stocks continuing to move higher to confirm that this is more than just a bounce from the oversold condition of the markets after the recent sell-off.
1975 and 1956 Support: Both of these levels have been broken through and may act as resistance to any attempt to push back up. While I believe the close on Thursday below 1956 marked the end to the present rally, we might see the SPX try to recover 1956 on Tuesday or Wednesday. If it can close strongly above 1956, the present bounce may turn into another rally.
Support levels at 1930 and 1919 are both light support and would most likely just delay a strong pullback by a day at most. On Thursday the SPX closed right at 1930. On Friday the SPX fell to 1919 and bounced off that light support level to close at 1925 which may signal a bigger bounce is coming for Monday. For Monday the SPX moved back above 1930.
Strong Support Levels are at 1870 and 1840. The 1870 level is below the 100 day EMA so I am expecting this pullback to reach that far but a lot now depends on how strong the recovery bounce may be. 1840 is below the 200 day EMA and would mark a serious correction. A break of 1870 is a definite signal that those investors not holding Ultra short ETFs or SPY PUT Options 2 months out, should be doing so by this point for a bigger move lower.
The other two support levels not shown in the chart above are 1775 and 1750. I have explained that these two are critical support for the present bull market. While 1775 is important it is 1750 that is now the bottom line.
A break of 1750 would mark a severe correction of 180 points which is below a 10% correction from the most recent high. This would be the biggest correction since April 2012. A pull-back of that size would definitely stun investors at this point and it is not something I am anticipating as there are no signs of any impending correction of that magnitude. If stocks did get this low it would become questionable if the correction would move down at least another 5%. This has to be assessed as the present pullback gets underway.
My Pullback Outlook: I have been waiting for a pull-back this summer to between 1870 to 1919. I still believe there are too many signs against a bear market or a severe correction beyond 10%.
The market direction at this point must fall below 1919 at the start of this week to confirm a continuation of the pullback. If that fails to happen then the sell-off from Thursday and Friday was not the start of a move lower.
Momentum: For Momentum I am using the 10 period. Momentum has been the best indicator, replacing MACD as the most accurate indicator. Momentum is now negative but pushed back higher today from Friday’s close.
MACD Histogram: For MACD Histogram, I am using the Fast Points set at 13, Slow Points at 26 and Smoothing at 9. MACD (Moving Averages Convergence / Divergence) issued sell signal on July 8. Today’s sell signal was almost identical to Friday’s.
Ultimate Oscillator: The Ultimate Oscillator settings are: Period 1 is 5, Period 2 is 10, Period 3 is 15, Factor 1 is 4, Factor 2 is 2 and Factor 3 is 1. These are not the default settings but are the settings I use with the S&P 500 chart set for 1 to 3 months. The Ultimate Oscillator is now deeply oversold but looks set to move back higher.
Rate of Change: Rate Of Change is set for a 21 period. The rate of change is indicating that a change back to up may be in the works for the start of the week.
Slow Stochastic: For the Slow Stochastic I use the K period of 14 and D period of 3. As the Slow Stochastic tries to predict the market direction further out than just one day. The slow stochastic all of last week was negative and indicated lower prices were coming. On Monday at the close the sell signal is still active.
Fast Stochastic: For the Fast Stochastic I use the K period of 20 and D period of 5. These are not default settings but settings I set for the 1 to 3 month S&P 500 chart when it is set for daily. The Fast Stochastic at the close on August 4 is signaling a strong up move for stocks for Tuesday and issued a buy signal at the close..
Market Direction Outlook And Strategy for August 5 2014
The market took the entire first half of the day to finally get some steam up and move higher. The technical indicators are negative but a number are pointing to a higher day on Tuesday.
Today’s rally finally broke through 1930. If it can break through 1956 and close solidly above it on reasonably good volume, it could disrupt the down move from Thursday nd Friday and revert back to up for stocks.
The outlook then for Tuesday is for stocks to be weak in the morning and then to advance and continue to rebound. At present this is simple a rally from an oversold condition but that does not mean trades cannot be done. I did a number of trades today but continue to stay cautious and I am taking on smaller positions and keeping a bit more capital out of the market. Still though today was nice to see. If however stocks continue to move lower on Tuesday I will reassess and post my outlook in the morning.
Stay FullyInformed With Email Updates
Market Direction Internal Links
Profiting From Understanding Market Direction (Articles Index)
Understanding Short-Term Signals
Market Direction Portfolio Trades (Members)