
The market direction outlook for Friday was for stocks to try a rally in the morning but for any rally to fail and the market to continue to move lower as the correction deepens. That is what happened as the ovesold condition of the market saw investors buy in the morning but the correction to continue in the afternoon. With the Ukrainian Crisis possibly heating up, Monday should be an interesting day for stocks. Let’s take a look at Friday’s action.
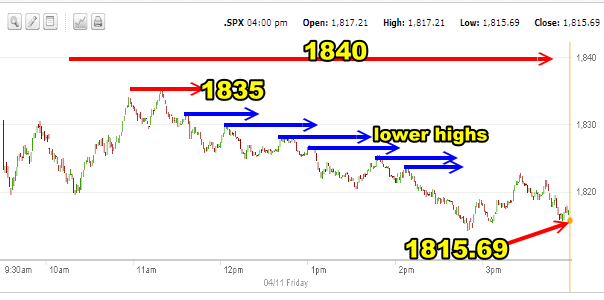
Market Direction S&P Intraday Chart April 11 2014
The morning started off choppy on Friday but when 1820 was tested twice and held, investors jumped in and pushed the S&P higher up t0 1835. The problem though is that this is still below support at 1840. Once support broke at 1850 on Thursday the S&P fell quickly to 1840. Once 1840 broke on Thursday, more investors rushed to sell. Friday’s morning push to 1835 showed exactly that. After two attempts to push through 1835, a lot of investors didn’t want to wait for 1840 to get out and started selling as the second attempt failed on Friday. That caused a pattern of lower highs as each high saw another wave of selling throughout the afternnon. A late day rally attempt was feeble and failed leaving the S&P to close at 1815, near the lows of the day.
Advance Declines For April 11 2014
Declining issues commanded another strong lead on Friday with 69% of stocks declining and 28% rising. There were only 36 new highs but 105 new lows. The number of new lows is starting to rise as momentum continued now to favor the downside.
Market Direction Closings For April 11 2014
The S&P closed at 1815.69 down 17.39. The Dow closed at 16,026.75 down 143.47 points and ready to fall below 16000. The NASDAQ closed at 3999.73 down 54.37 for what has become simply one of the worst declines in years for the NASDAQ as investors flee speculative stocks and now tech stocks in general.
The Russell 2000 ETF IWM fell $1.55 or 1.38% to $110.41.
Market Direction Technical Indicators At The Close of April 11 2014
Let’s review the market direction technical indicators at the close of April 11 2014 on the S&P 500 and view the market direction outlook for April 14 2014.
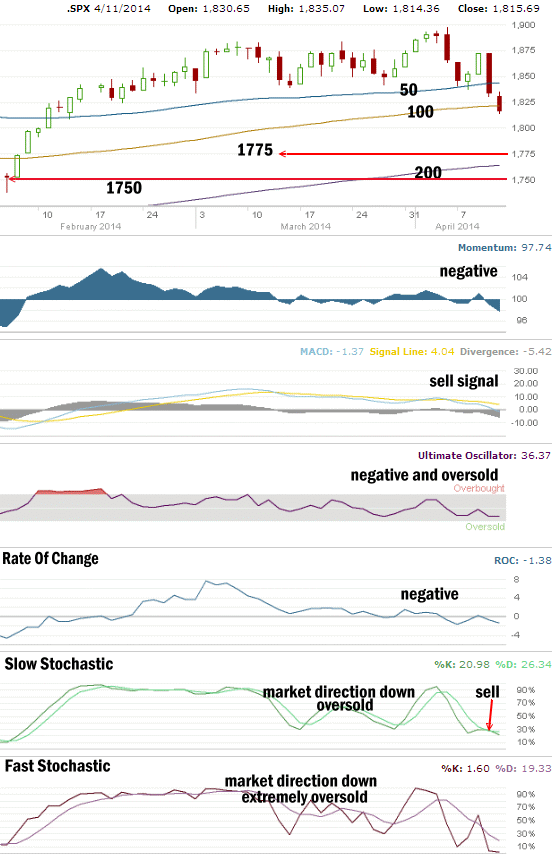
The 1750 level has been holding the S&P up since the correction ended in early February. All the levels of any support above 1800 have been broken last week. This leaves the next area of any real support to be down around 1775. The market direction lower mall stall a bit at the 1800 level but it will be short-lived as there is not much support at that level. However a slip below 1800 will bring in more selling as those who bought on Friday will also now want back out. All of the indexes are in serious trouble. The S&P is now below the 100 day exponential moving average (EMA). The NASDAQ is plunging toward the 200 day EMA. The Dow is now below the 100 day exponential moving average (EMA). The IWM ETF for small caps closed just above the 200 day EMA after touching that moving average intraday on Friday.
For Momentum I am using the 10 period. Momentum has been the best indicator over the past four months, replacing MACD as the most accurate indicator. Momentum has turned decidedly negative on Friday and points to further declines ahead.
For MACD Histogram, I am using the Fast Points set at 13, Slow Points at 26 and Smoothing at 9. MACD (Moving Averages Convergence / Divergence) issued a sell signal on Apr 7. The sell signal of April 7 gathered more momentum to the downside on Friday.
The Ultimate Oscillator settings are Period 1 is 5, Period 2 is 10, Period 3 is 15, Factor 1 is 4, Factor 2 is 2 and Factor 3 is 1. These are not the default settings but are the settings I use with the S&P 500 chart set for 1 to 3 months.
The Ultimate Oscillator is negative fallen into extreme oversold territory.
Rate Of Change is set for a 21 period. The rate of change is has moved lower and is more negative on Friday indicating that the change to the downside is seeing more investors sell and the rate of momentum to the downside is gathering momentum.
For the Slow Stochastic I use the K period of 14 and D period of 3. The Slow Stochastic is signaling that the market direction is down and it is very oversold. It issued a sell signal on Friday.
For the Fast Stochastic I use the K period of 20 and D period of 5. These are not default settings but settings I set for the 1 to 3 month S&P 500 chart when it is set for daily. The Fast Stochastic confirmed Thursday’s sell signal on Friday and is extremely oversold. Looking at the readings in the chart above you can see just how extreme the selling was on Friday as investors are now fleeing stocks. Readings this low show how fearful investors became on Thursday.
Market Direction Outlook And Strategy for April 14 2014
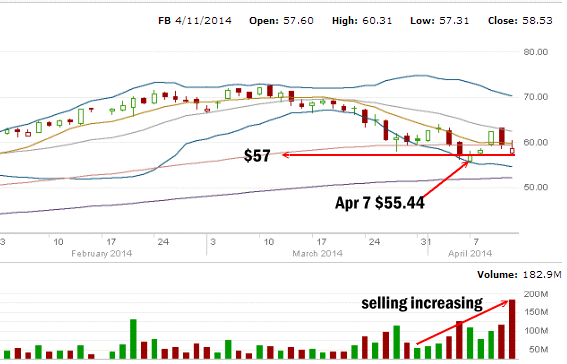
The only good thing to say about the Market Direction Technical Analysis at the close on Friday was that the market is deeply oversold and often that leads to a bounce. Investors are dumping shares now and pushing many stocks, especially speculative stocks, down. In the midst of the plunge there are signals that the oversold market condition may be getting ready for another bounce back attempt. Stocks like Facebook Stock for example, fell to their lowest on April and despite the increased selling they are not falling lower.
Facebook Stock
Facebook for example fell to $57.31 on Friday despite the heavy volume. This though will last only for a very short time if selling pressure continues to rise. Eventually buyers will move lower to pick up shares cheaper.
Ukrainian Crisis
Monday will probably also be impacted by the escalation of the Ukrainian crisis. That crisis on its own has plunged the Russian stock market over 20% and helped to drop the Russian currency. The escalation will most likely mean even more sanctions which will lead to higher tensions yet again. It’s is just one of those scenarios where it “never rains, but pours”.
Monday Outlook
The outlook then is for stocks to continue to move lower. Again a rally attempt may occur in the morning before more selling erupts. With indexes like the NASDAQ and IWM now down to the 200 day exponential moving average (EMA), I will be adding in some deeper in the money covered calls to positions and increasing the number of Spy Put Options being bought from 50 to 80 put contracts. I will be trading with the emphasis to the downside.
Stocks could see a bounce higher if something favorable comes out early next week regarding the Ukrainian crisis, but that, at present, seems unlikely. The outlook for Monday is lower for stocks and I will be trading with strategies that take advantage of downside action. Remember that the market direction can fool investors and we could see an attempt to rally back. I will be using any rally to put in place more trades to the downside such as my Spy Put Options because at this point any rally would be only technical in nature as the direction now remains lower until stocks eventually fall back to fair valuations which should bring in buyers. The first clue will be a sustained drop in selling volumes on stocks and a decline in the number of new lows. On Monday I am traveling for part of the day. Trades I do will be by phone so I will not be able to update trades in my website until close to the end of the day.
Market Direction Internal Links
Profiting From Understanding Market Direction (Articles Index)
Understanding Short-Term Signals
Market Direction Portfolio Trades (Members)
Market Direction External Links
Market Direction IWM ETF Russell 2000 Fund Info
Market Direction SPY ETF 500 Fund Info