
The Market Direction on Friday was exactly what was expected. On Thursday of last week I had expected profit taking. That didn’t really develop. Instead stocks pushed higher within a few minutes of the open. So profit taking was delayed until Friday. I was surprised by the number of analysts who thought there was a lot more than profit taking going on in the stock markets. I didn’t see it their way. All I saw was the market direction shifting sideways and the profit taking going on. With 30% of all stocks now setting at 52 week highs, there was bound to be profit taking. Whether that profit taking continues on Monday, I’ll have to look at the technical indicators and see what they say about market direction.
Market Direction Closing For Apr 12 2013
The S&P 500 closed at 1588.85 down 4.52 points and the Dow closed at 14865.06 almost unchanged at just 0.08 down. The NASDAQ closed at 3294.95 down 5.21 points after setting a new 7 year high on Thursday.
Market Direction Hammering Gold
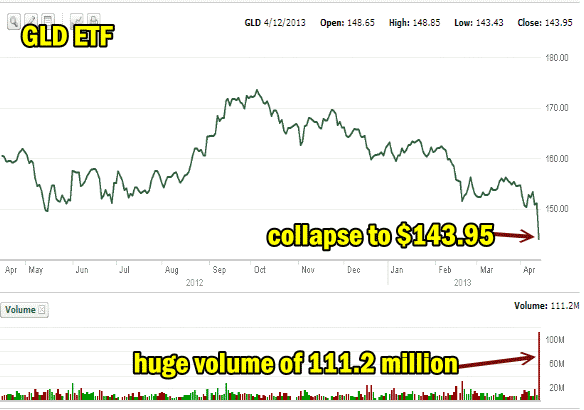
The worst performance by far was the price of gold bullion which literally collapsed on Friday and continued to fall after hours as it plunged through 1500 and closed at $1477.60 down an incredible $86.70 or 5.54% for the day. The GLD ETF collapsed to $143.95 the lowest level since April 2011 on huge volume of 111.2 million shares. It is obvious that despite analysts comments that the pull back in gold is overdone and this is not the start of a bear market for gold, investors are not in agreement and they were voting with their shares.
S&P 500 Market Direction Daily Chart
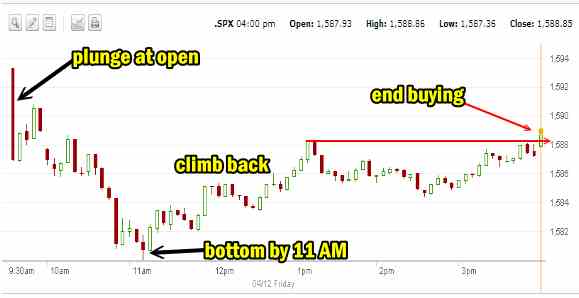
The S&P market direction plunged at the open rallied back where I bought my IWM Trading For Pennies Trade for the day and then fell to a bottom by 11 AM. The market direction then climbed back and by about 1:00 PM the top was set for the rest of the day. Profit taking took place all day long and when the bottom was hit at 11 AM buyers were back picking up stocks here and there. The close saw a flurry of buying for the last 5 minutes which pushed the S&P 500 just above the 1:00 PM high.
Market Direction Russell 2000 (IWM)
Meanwhile the small cap ETF, the Russell 2000 (IWM) pulled back to $92.92 from Thursday’s close of $94.02 but then it clawed its way back to close at $93.64, down just shy of half a percent. The most important indication to take away from the Russell 2000 is that it is still above the 50 period simple moving average (SMA) which remains a good sign that the market direction will be higher this week.
Market Direction Technical Indicators At The Close of Apr 12 2013
Let’s take a moment now and review the market direction technical indicators at the close of Friday on the S&P 500 and view the outlook for Monday April 15.
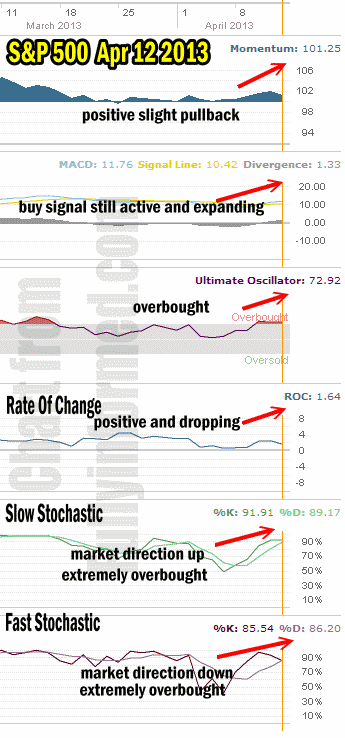
For Momentum I am using the 10 period. Momentum is positive with a slight pullback reflecting the profit taking that was occurring.
For MACD Histogram I am using the Fast Points set at 13, Slow Points at 26 and Smoothing at 9. MACD (Moving Averages Convergence / Divergence) issued a buy signal yesterday and is rising despite the profit taking.
The Ultimate Oscillator settings are Period 1 is 5, Period 2 is 10, Period 3 is 15, Factor 1 is 4, Factor 2 is 2 and Factor 3 is 1. These are not the default settings but are the settings I use with the S&P 500 chart set for 1 to 3 months.
The Ultimate Oscillator remains still strongly overbought which is a good sign for the bulls.
Rate Of Change is set for a 21 period. Rate Of Change is still positive but downs lightly due to the profit taking.
For the Slow Stochastic I use the K period of 14 and D period of 3. The Slow Stochastic is signaling market direction is still up but extremely overbought.
For the Fast Stochastic I use the K period of 20 and D period of 5. These are not default settings but settings I set for the 1 to 3 month S&P 500 chart when it is set for daily. The Fast Stochastic is signaling that the market direction is down and extremely overbought. The Fast Stochastic may be signaling more profit taking will occur on Monday but the signal down is very weak.
Market Direction Outlook And Strategy for Apr 15 2013
The market direction remains bullish. We had expected profit taking on Friday and that is what was seen. All the market direction technical indicators are in fine shape. The Fast Stochastic is signaling that there could be more profit taking on Monday but it will be weak. The Slow Stochastic and Fast Stochastic indicators are both almost neutral rather than up or down so we could see a bit of weakness at the open tomorrow.
The consensus though is for the market direction to still attempt to push higher on Monday even if profit taking should continue. I won’t be surprised then if Monday we see some weakness in the morning and then a repeat performance from Friday with the S&P 500 market direction changing to up, in the afternoon.
I am continuing with Put Selling but still staying with small amounts of put contracts and in many cases selling two sets of naked puts one lower than the first. The market direction is up over 10% since January. This run may have further to go as we are still in April but come May we could see a much bigger correction. I will therefore continue to close puts early and lock in my profits every chance I get. I want to keep as much cash as possible on the sidelines come May just in case the market direction does pull back lower. I would love to have a lot of cash to invest in more puts if the spring-summer season is weak for stocks, which is what I am expecting.
Internal Market Direction Links
Profiting From Understanding Market Direction (Articles Index)
Understanding Short-Term Signals
Market Direction External Links