Market Direction for the short-term has changed again, while the mid-term stock market direction remains with a range bound stock market. The analysis of the stock market after the stock market move up on Friday shows that the market timing indicators are predicting the market direction bias is now up. While timing the market is not science the market timing tools I use for the analysis of the stock market are based on sound principles which include among others, volume, momentum and sentiment.
Since the stock market correction began there have been a number of market direction changes. On April 2 when the S&P 500 made a new intraday high the market has pulled back until it appears to have bottomed on June 4 around 1266. This marked a retrenchment of about 155.64 points or 10.9% from the stock market high.
Analysis of the stock market over a period of decades shows that a correction of 10.9% is normal within an ongoing bull market and as such there is no reason to believe the bull market is not still with us and that longer-term the market direction trend remains up.
While the market direction overall shows a range bound market, analysis of the stock market S&P 500 chart for the past few weeks is showing many encouraging market timing technical signs.
Market Direction Chart On The S&P 500
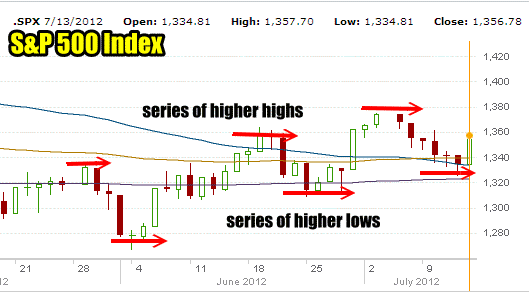
The short-term market direction chart below shows that market direction is continuing to move higher. The stock market direction is seeing a return to higher lows and higher highs. These all point to higher prices ahead and a recovery from the May and early June selling.

Market direction chart for the S&P 500 shows a pattern of higher lows and higher highs, a clear signal the market direction is continuing to move higher.
Market Timing Technical Indicators for July 12 2012
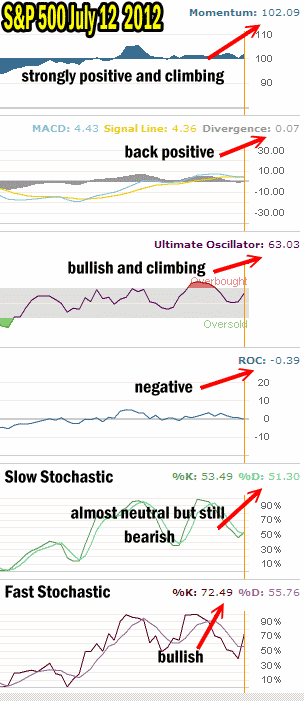
The market timing technical indicators for Friday show the market as changing market direction once again with the bias returning to the upside.
Timing The Market – What The Timing Tools Say
A brief summary of each of my market timing indicators show that the consensus is definitely for market direction back up. Throughout the latest downturn Momentum did not go negative.
Momentum since June 26 has not been negative and is pushing higher again now, another indication that market direction is higher.
MACD Histogram or (Moving Average Convergence / Divergence) is just barely positive but has recovered from a negative reading on Thursday which is a bullish sign.
The Ultimate Oscillator which I use every day on just about every stock is pushing back up and is bullish again signalling that market direction will be up on Monday.
Rate of Change will need to see a positive day on Monday in order to support the market direction move back up.
The Slow Stochastic is almost neutral with its readings of %K 53.49 and %D 51.30. if Monday is positive this indicator will turn positive also.
The Fast Stochastic which is a very short term market timing indicator is solidly bullish with a reading of %K 72.49 and the divergence in the indicator will soon turn back to overbought in the stock market if the market direction continues higher on Monday and Tuesday.

The majority of my Market Timing Indicators are back bullish
To the downside there is primarily one market timing indicator that is a bit concerned. While I do not use volume as a market timing indicator every day, volumes on Friday’s market rally were not very high and indeed were among the lowest volumes for the week. But it was a Friday in the middle of July and a lot of investors are away.
Candlestick Chart Analysis
For those investors who follow candlestick chart analysis,the closing candlestick on Friday was a White Opening Marubozu. This candlestick gave a buy signal at the close on Friday for the S&P 500 Index. This candlestick showed that market prices rose almost all day but they did not close at the high for the day. Nonetheless it forms a long while body candlestick which according to candlestick chart analysis is bullish.
Market Direction Outlook And Market Timing Comments For July 15th Week
Investors remain disappointed that the Federal Reserve has not turned to QE3 to bolster the economy and naturally greased the wheels of the stock market. Eventually though the mess in Europe will be pushed aside from investors’ minds unless something far greater should occur. While Greece or in my opinion Finland may be among the first to leave the Euro, either of these two will have some impact on the markets but the longer the period of time before either leave the Euro the easier it will be on the investing world. If either country should leave the Euro sometime in late fall or in the new year, it may become almost a non-event for stocks in general and perhaps politicians are hoping for just such an outcome as they keep kicking the Euro debt can further down the road.
As the markets prepare to enter August, it is only a month longer before the fall season approaches and stocks may pick up in the fall. With the US election by then in full swing stocks may experience another rally to move the indexes higher.
Comments that the Federal Reserve is out of ammunition I believe are premature. I do believe Bernanke is ready to act in a crisis but to act now while the economy is still continuing to slowly expand may not be the best course of action. Keeping ammunition dry until a severe crisis is at hand may be the better choice.
Options Expiry This Week and Trader’s Almanac
This week marks the expiry of July options on Friday. On the Monday of this week the Trader’s Almanac reports that the Dow has been up 7 of the last 8 years on the first Monday of July options expiry week, but on the Friday it has been down 7 of the last 11 years with a 4.6% decline in 2002 and a 2.5% decline in 2010. I don’t see any such market direction decline percentages this year unless something far more dramatic than what we have seen lately should emerge.
Short-Term and Mid-Term Market Direction
Mid-term the market direction remains range bound. But the short-term market direction bias has changed back to up and if Monday is an up day which the majority of my market timing indicators are predicting, then this will solidify those remaining market timing indicators that are still somewhat bearish and turn them bullish as well. Investors should remember that the market direction on the S&P for the past few weeks has been higher lows and higher highs, both of which are bullish signs that the market may be getting readying to try to push market direction higher once again.
