
The plunge of IBM Stock as it had another poor quarter is wearing on investors. Today’s volume was the largest in more than 5 years. Even the volume in the bear market of 2008 to 2009 had few days with the kind of volume IBM Stock saw today.
IBM Made Billions – So Why The Plunge
IBM made billions this past quarter. The problem is in China where profits plunged 22 percent. A story out of CNBC discussed the possibility that China is trying to cut out large American technology firms from lucrative business projects following the NSA scandal. Whether there is any truth to the article is unknown but IBM reported a 40% decline in hardware sales this past quarter in China. That’s a shocking loss of sales for IBM to have sustained. Across the board Asia-Pacific sales were down 5% which considering how much China makes up of IBM sales was actually not too bad. Nonetheless investors were dumping their shares. As usual once the dumping started more investors joined in. There was no reprieve during the day as the stock stayed under intense selling pressure. It might be considfered surprising that IBM stock did not fall further.
Investors Left With Losing Positions
So where does this leave investors with IBM Stock? All day I received emails from investors who had sold puts that are now deep in the money or bought stock that is underwater and wondering what to do next.
Here’s a typical question from an investor:
“I am holding 3 IBM Oct 19 175 puts @ 1.75 and 2 IBM Nov 16 180 puts @ 5.54. With the big earnings miss surprise I will be looking to close the 175s/roll a week at 175 looking for a rebound, or down to 170 and out to Dec depending on the price action today. Plan to roll the 180s dn and out to Jan @ 170 for a net credit if possible.
When I planned this trade I thought the 180 was vulnerable, but saw moderate support btw 170-175 back to mid 2012.
My goal is income, but if I get exercised I can live with it and sell covered calls. I am retired and have sufficient pension income such that I don’t need to drawdown my savings.
My main question is how to finesse the rolls with the price this near to the 175 strike and this close to expiration.
I have been following your site for a year and have learned much from your articles and consider membership a bargain. Thank you for sharing your knowledge! – Don”
My suggestions for his Put Selling trade will be posted to the members section as it delves deeper into strategies but for now, suffice to say there are a lot of investors caught in the downturn today.
IBM Stock’s Great Bear
IBM Stock is caught in a severe bear market that has today broken through long-term support levels. Let’s look at a few charts to see where the stock may be heading and how investors might find some opportunities to profit. The great thing about a stock that is caught in a bear market is the wild price swings which pumps up volatility and makes option selling highly profitable.
The last 12 months of IBM Stock is in the chart below. You can see that a top was put in IBM Stock back around April 15 when IBM Stock almost reached $216.00. With the close today of $174.83, the stock is actually down only 19% which all things considered is not as bad as it could be.
You can see though the familiar pattern of lower lows and lower highs which marks a stock in trouble. There are some interesting patterns in IBM Stock worth mentioning.
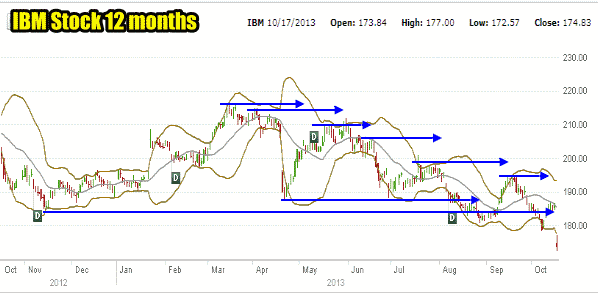
Tradable Patterns in IBM Stock
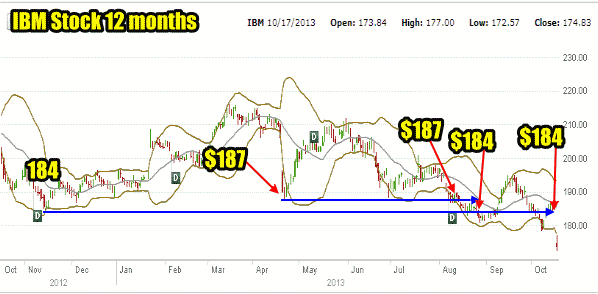
Looking at the lows in IBM Stock you can see that the low of last November of around $184 was revisited several times in late August and early September and then once again just recently in October before today’s big drop. The other big drop was in April of this year when IBM Stock plunged from $211 to $187 in just 3 days. That area of $184 to $187 marked a lot of support for IBM Stock and made Put Selling out of the money at $180 and below, easy.
Support Levels For Put Selling
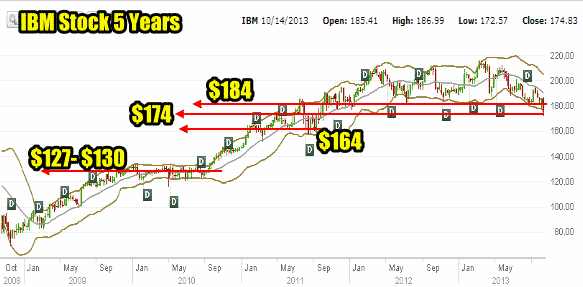
With the present support levels broken at $184 there are two more support levels left from 2011. The $174 level, which IBM Stock punched through today but closed back above and the $164 level. If those both break the next level is $127 to $130 from 2009 to 2010.
IBM Stock Put Selling And Put Strikes to Sell
Based on the above chart you can see that Put Selling right around those levels makes sense. By taking on small put positions an investor can earn decent returns and protect to the downside. Tomorrow I would expect either a further push back to try to see how strong support is at $174 and then a rebound attempt. Any push lower tomorrow and the $170 put for November 16 options expiry will grow beyond 1% making it highly lucrative.
$170 IBM Stock Put Strike
The $170 is a nice put strike to consider selling and would be my first choice. It is close enough to both the $164 and $174 support levels to make it ideal. At $170, if IBM should break through $170, it would be easy to roll down to $165 and out 3 months and do so with a profit. An investor might have to add a small amount of capital to allow for Put Selling another put or two to bring in really good premium on a roll down but considering that there is no desire to own shares and the support levels in IBM stock, then placing more puts at risk of assignment is not much of a question because my intent would be to close them rather than accept shares. If shares were assigned I would dump them and move back to Put Selling to recover any losses from dumping the shares.
The $170 put strike is also close enough to support at $174, that there might just be enough support hanging in at $174 to keep the stock from falling back below $170. This would then mean the stock could recover and push higher. It might even rally back to $180.
Looking at the last big collapse in April 2013, the stock fell dramatically but within days it was starting to recover and then pushed back all the way to $211 by the end of May 2013. I don’t expect that to be the case this time around. The big collapse last April was considered a huge opportunity by many investors including many institutional ones. Today’s sell volume is indicating that a lot of investors bailed, both big and small. Every investor who bought stock in the past 12 months and is still holding it, is now looking at losses. This is why the selling was so dominant today.
$165 IBM Stock Put Strike
Unless earnings improve over the next couple of quarters I am expecting IBM Stock to fall as low as $165. It may set up a trading pattern from $165 to $175 or even as high as $180. The $165 put would be my next put strike if the $170 was broken through in further declines. IBM is making plenty of money and earnings are good. The dividend is quite good. This company is not collapsing or going to disappear but at 13 times price to earnings, it will probably trade right around longer term support at the $174 level into the next quarterly earnings. It pays a $3.80 annual dividend which is just above 2 percent. Total revenue stands at $101 billion. IBM is not going away but investors need a plan to profit from the volatility and opportunities the upcoming weeks and months will bring.
By staying with the above support charts and trading puts near support levels investors could be setting themselves up for some decent profits. They are also placing themselves into a protective stance that makes these trades reasonable, both from profit earned and the ability to roll lower and out of harm’s way in the event the stock declines further.
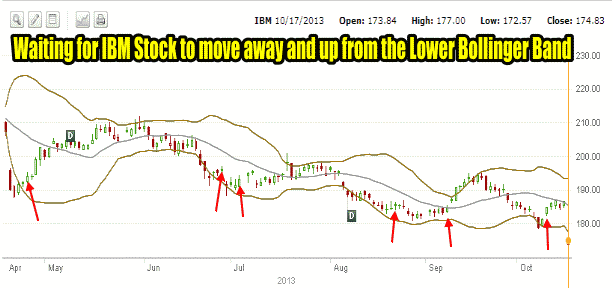
IBM Stock has had some excellent rallies but for put sellers, each rally should be taken as an opportunity to buy back naked puts and then wait for the stock to move lower and then resell puts again. By keeping a good eye on how the stock handles after reaching the Lower Bollinger Band investors can pinpoint entry points better. The clue for IBM stock Put Selling is to wait for the stock to reach the Lower Bollinger Band and then trend sideways with a slight bias up. That’s the signal to sell naked puts. Once the stock pushes higher an investor can check the naked puts and buy them back and close the trade profitably. Holding these naked puts until option expiry is not wise.
Using the Lower Bollinger Band To Time Put Selling
Since April for example, an investor who has used the Bollinger Bands at the default settings of 20 and 2 would have made exceptionally good profits. In the daily IBM Stock chart below since April 2013, you can see that by waiting for the stock to reach the Lower Bollinger Band, then move away from the Lower Bollinger Band with a bias sideways and then up, an investor would have sold naked puts at least 6 times with very good profits. I have marked those ideal areas with red arrows. Then once IBM Stock moved higher the investor needed to consider watching IBM Stock from when it reached the Middle Bollinger Band to make sure it continued to climb. When it didn’t climb, the naked puts should have been bought back and the trade ended profitably.
IBM Stock Put Selling Opportunities Summary
In summary, the plunge of IBM Stock has created an excellent opportunity for further Put Selling profits from investors. By knowing the support levels and using the Bollinger Bands to assist in knowing when to sell puts and buy them back to close the trade, an investor should be able to earn very good profits and avoid assignment no matter whether IBM Stock recovers or falls to the next level of support.
Internal Stock and Option Trades Links
Put Selling Strategies For Members
Covered Calls Strategies For Members
Profit And Income Strategies Index
Stock and Option Strategies For Members
Stock And Option Trades Explained For Members