
 Investor nervousness as the new Presidency got underway on Monday, kept stocks in check on Monday. By the close however, as we have seen repeatedly in the past few weeks, stocks closed well off their intraday lows.
Other stocks that kept the stock market under pressure included General Electric Stock which closed down 2.55% to $29.75, Qualcomm stock which fell 12.72% to $54.88, Halliburton Stlock which was down 2.92% to $54.80, Schlumberger Stock (SLB) down 2.57% to $84.27, Kansas City Southern (KSU) down 2.63% to $85.60, Aetna Stock (AET) down 2.72% to $119.20, Delta Air Lines Stock (DAL) down 3.43% to $48.77 and Autozone (AZO) down $30.67 to $739.35.
All of these helped keep the markets in the red on Monday.
S&P Index Close
The S&P index ended the day down 6.11 to close at 2265.20 although during the day the index dropped below 2260 again.
Dow Jones Index Close
The Dow Jones ended lower by 27.40 to 19,799.85 recovering from a much bigger intraday drop.
NASDAQ Index Close
The NASDAQ closed down just 2.39 points at 5,552.94 after recovering almost all the day’s drop.
Stock Market Outlook

Stock Market Outlook review of Jan 23 2017
Chart Comments At The Close:
The Bollinger Bands Squeeze is continuing as the S&P stays in a tight trading range stuck between 2260 and 2270.
Even the drop today to 2257 was snapped up by investors who pushed the index back to 2265 to close the day at the 21 day moving average (middle Bollinger Bands).
There are still no indications which way the Bollinger Bands Squeeze will end and this is now the longest period since 1957 that the S&P has stayed tightly range bound within a 10 point spread.
However this evening’s market close shows the 50 day is rapidly moving higher. This could be a signal that we will see the S&P push above the Lower Bollinger Band shortly and signal a move higher for the S&P.
The other two major moving averages, the 100 and 200, are still advancing.
Support Levels To Be Aware Of:
Light support is at the 2250 level. There is also light support at 2195 but better support is at 2180 and then 2150.
Stock Market Outlook: Technical Indicators:
Stock Market Outlook technical review for Jan 23 2017
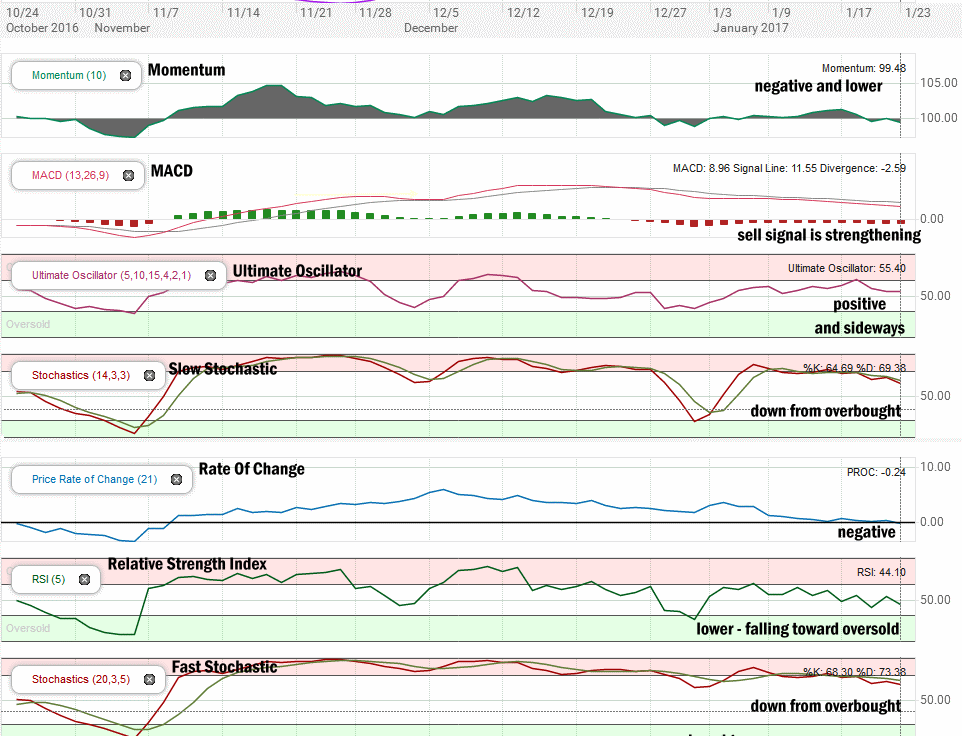
Momentum: For momentum I use a 10 period when studying market direction. Momentum is still negative and moving lower.
MACD Histogram: For MACD Histogram, I am using the Fast Points set at 13, Slow Points at 26 and Smoothing at 9. MACD (Moving Averages Convergence / Divergence) issued a sell signal Dec 23 2016. The sell signal is continuing to strengthen.
Ultimate Oscillator: The Ultimate Oscillator settings are: Period 1 is 5, Period 2 is 10, Period 3 is 15, Factor 1 is 4, Factor 2 is 2 and Factor 3 is 1. These are not the default settings but are the settings I use with the S&P 500 chart set for 1 to 3 months. The Ultimate Oscillator is positive but moving sideways.
Slow Stochastic: For the Slow Stochastic I use the K period of 14 and D period of 3. The Slow Stochastic tries to predict the market direction further out than just one day. The Slow Stochastic is still signaling down from overbought readings.
Rate of Change: Rate Of Change is set for a 21 period. This indicator looks back 21 days and compares price action from the past to the present. The rate of change signal is negative which indicates higher prices should not be expected.
Relative Strength Index: The relative strength index is set for a period of 5 which gives it 5 days of market movement to monitor. It often is the first indicator to show an overbought or oversold signal. Readings are now below 50 and moving toward oversold.
Fast Stochastic: For the Fast Stochastic I use the K period of 20 and D period of 5. These are not default settings, but settings I use for the 1 to 3 month S&P 500 chart when I have it set for daily views. The Fast Stochastic is signaling down from overbought.
Stock Market Outlook for Tomorrow – Tuesday Jan 24 2017
For Tuesday Jan 24 2017 the technical indicators are now 6 negative signals versus 1 positive signal. For Tuesday we could see the market try to move higher but technically the market is setting up to move lower.
The closing candlestick is still signaling neutral on the market direction.
The outlook is for a negative close on Tuesday although my personal outlook is for stocks to try for a positive day. Again, it is important to remember that it is rare when my guess has been more accurate than the technical indicators, so expect volatility, choppiness, some bounce attempts but a probable negative close again on Tuesday. The underlying trend is still higher but we may have to wait a few more days before we see if the underlying trend can swing the stock market higher.
Caution is still advisable until we get a clear break of this tight trading range on the S&P.
Stay FullyInformed With Email Updates
Market Direction Internal Links
Profiting From Understanding Market Direction (Articles Index)
Understanding Short-Term Signals
Market Direction Portfolio Trades (Members)
Market Direction External Links
IWM ETF Russell 2000 Fund Info
Market Direction SPY ETF 500 Fund Info