The market direction outlook for Thursday was for stocks to continue to move sideways for at least another day. The bias was to the upside, but the overbought nature of the market naturally would dictate a rest to consolidate the gains and build support. Both the fast and slow stochastic indicators pointed to a sideways day. That did not happen. Earnings became the catalyst along with other news about Ford global sales being up pointing to the possibility that the global economy is not as “bad” as many continue to predict. A record 45 cents per share as sales were up 12%. Analysts has expected earnings of 37 cents a share.
A survey out of HSBC pointed to higher Chinese manufacturing activity than predicted. Gold rose $16.30 an ounce to $1350.30 continuing to keep alive the hopes of many investors who are looking for a rebound in gold and many gold miners. Indeed Goldcorp Stock (G) and Barrick Gold Stock (ABX) rose among other gold producers. Goldcorp has net earnings of just $5 million down from $498 million which earned just 1 cent a share versus 61 cents last year at this same quarter. Total revenue plunged $929 million and the stock advanced $1.19 despite the collapse in earnings.
December crude on New York moved up 25 cents to $97.11 US a barrel. Meanwhile heavy buying in the energy section pushed up energy stocks an average 0.88 percent.
After Hours Reports
Microsoft Stock (MSFT)
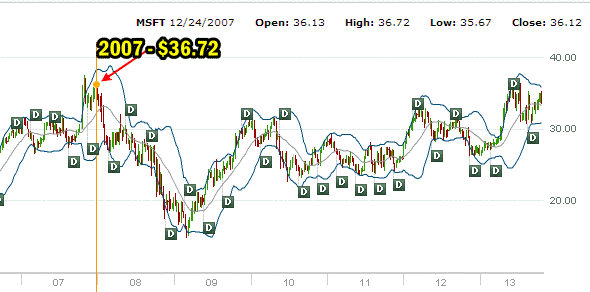
Microsoft Stock rose dramatically after hours as the company reported a huge rise in revenue to $18.53 billion versus $17.79 billion for the same quarter last year. Analysts were predicting .54 cents while Microsoft turned out .62 cents a share. This marked a 16 percent jump at a time when many analysts doubted Microsoft would even meet their projections of 54 cents a share. Microsoft shares surged 7.4 percent to $36.21 after hours as it neared the highest level since 2007. The stock is ready to break out and tomorrow could see the stock push beyond to valuations beyond $37.10 which would be highest levels since 2001. For Put Selling the stock is on a strong uptrend which makes selling naked puts out of the money attractive. The strategy that should be used is selling out of the money and closing quickly on any signs of a pullback in Microsoft Stock.

Amazon Stock (AMZN)
Amazon Stock is not a stock I trade, but investors remain confident that Amazon Stock will continue to rise. CE) Jeff Bezos is unconcerned about profit focusing instead on pumping revenue back into the company as he takes it from a product company to a media service company. Without a doubt it is the world’s largest retailer with revenue up a stunning 24 percent in the latest quarter. This beats the average projection of $16.8 billion. Shares rose after hours 8.4 percent to $360 but book value is merely $18.04 a share with cash flow of $6.14 a share. Profit margin is a shockingly slim 0.21%. Investors though are almost religious in their belief of Jeff Bezos to continue to promote Amazon Stock and push it higher. Now trading at 125 times projected earnings, Bezos is determined to forget profits and concentrate entirely on ploughing back into his company all revenue.
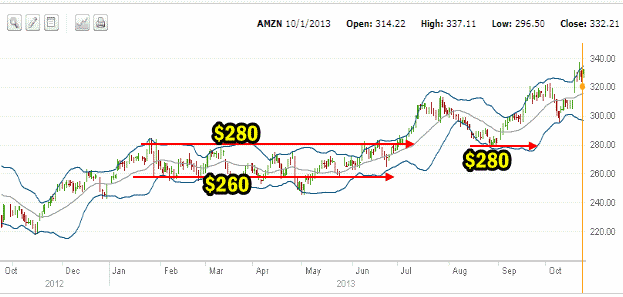
For Put Selling the best period was earlier this year when the stock was stuck in a range between $260 on the low end of $280 on the upper end. But there is tremendous volatility in the stock and unlike Apple Stock, Amazon Stock is not the easiest for my strategy of Put Selling. I far prefer Apple Stock for my strategy as the technical timing tools are far more efficient at picking enter and exit points where with Amazon Stock, the risk is possibly a bit higher but the returns are not as good as Apple Stock for put selling.

Market Direction S&P 500 Intraday For Oct 24 2013
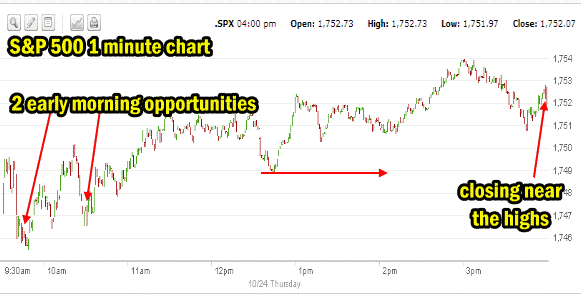
The intraday 1 minute chart for the S&P 500 below shows very little consolidation today. But we do have the same repeat pattern once again in the morning which continues to make my Trading For Pennies Strategy trades highly profitable. In the afternoon there was just one small test over the lunch hour and then the S&P moved high. The market direction close was not on the highs but near the highs.
Advance Declines For Oct 24 2013
The advance – decline ratio continues to point to an overheated market but there is some consolidating happening behind the numbers. Advancing issues were 56% versus 41% of all issues declining. Despite this though the market made 733 new highs versus 120 new lows. With so many stocks sitting near 52 week highs it does not take much to turn push them into new highs.
Market Direction Closing For Oct 24 2013
The S&P 500 closed at 1,752.07 up 5.69 but not a recovery from Wednesday when the market was down 8.29. The Dow closed at 15,509.21 up 95.88 or almost double yesterday’s loss of 54.33 points. The NASDAQ closed at 3,928.96 up 21.89 almost wiping out yesterday’s loss. The IWM ETF closed up .59 to $110.98 wiping out Wednesday’s loss.
Market Direction Technical Indicators At The Close of Oct 24 2013
Let’s review the market direction technical indicators at the close of Oct 24 2013 on the S&P 500 and view the market direction outlook for Oct 25 2013.

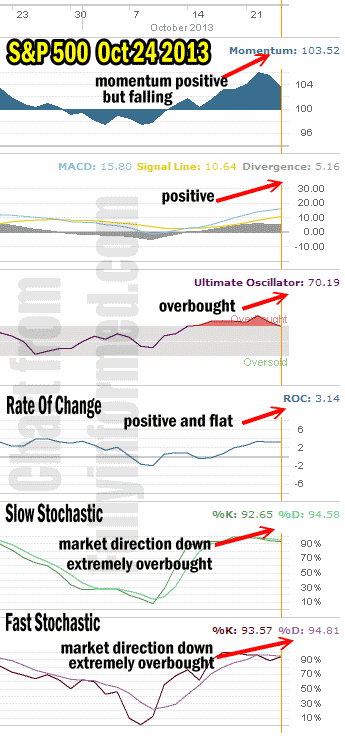
For Momentum I am using the 10 period. Momentum is starting to fall but remains positive. The overbought condition is being worked out of the market direction.
For MACD Histogram I am using the Fast Points set at 13, Slow Points at 26 and Smoothing at 9. MACD (Moving Averages Convergence / Divergence) issued a buy signal on Oct 14 and today that signal continued to point to a consolidation happening in the market.
The Ultimate Oscillator settings are Period 1 is 5, Period 2 is 10, Period 3 is 15, Factor 1 is 4, Factor 2 is 2 and Factor 3 is 1. These are not the default settings but are the settings I use with the S&P 500 chart set for 1 to 3 months.
The Ultimate Oscillator is still shows heavily overbought but today’s action continued to lower it.
Rate Of Change is set for a 21 period. The Rate Of Change continued to trend sideways reflecting no real concern that investors are bailing. Instead it still reflects investors picking up stocks.
For the Slow Stochastic I use the K period of 14 and D period of 3. The Slow Stochastic is signaling that the market direction is down. it is extremely overbought.
For the Fast Stochastic I use the K period of 20 and D period of 5. These are not default settings but settings I set for the 1 to 3 month S&P 500 chart when it is set for daily. The Fast Stochastic is signaling that the market direction for tomorrow is down and it too is extremely overbought.
Market Direction Outlook And Strategy for Oct 25 2013
The technical indicators re showing the stress of the overbought condition at present. The Slow Stochastic and Fast Stochastic are both indicating downside for Friday. The momentum is beginning to fall off and MACD is staying sideways. The move back up today for the S&P failed to erase Wednesday’s losses. The market is continuing to consolidate today even with the rise in the market.
Friday’s Outlook
The market still looks tired here and could use a breather. I still think the market has a good chance to push sideways tomorrow. While the overall bias is till higher, I won’t be surprised if tomorrow the market direction is flat.
Market Direction Internal Links
Profiting From Understanding Market Direction (Articles Index)
Understanding Short-Term Signals
Market Direction Portfolio Trades (Members)

