
The market direction outlook for Wednesday was for weakness and another failed effort to move above 2000 which is what happened today. A lot of the pressure is being brought from profit-taking which continued today although the utility sector which has been hit a number of times was back being picked up again today.
XLU ETF
If we look at the XLU ETF we can see that after running back up from the drop earlier this month, the utilities sector has turned sideways. Yesterday utilities sold lower but today the Congressional Budget Office indicated they predict the economy will grow by just 1.5% because of the poor first quarter. This had investors back questioning when interest rates will rise which once again meant utilities might not be such a poor purchase after all so investors were back picking up some shares of utilities that were down slightly.

XLU ETF to Aug 27 2014
Buying the dips, no matter how slight, continues to be the game and so with utility stocks off from their recent rally back, many investors felt it was worthwhile grabbing some of them for prices lower than just a few days earlier. Not a lot lower mind you, but the mentality seems to be, “prices were still lower” and that’s what counts right now.
Interestingly the Congressional Budget Office also predicted that the economy will grow by 3.4 % over 2015 and 2016 and they expect unemployment will remains below 6% into the foreseeable future. Exactly how they came up with the unemployment prediction I can only guess at.
SPX Market Direction Intraday One Minute Chart
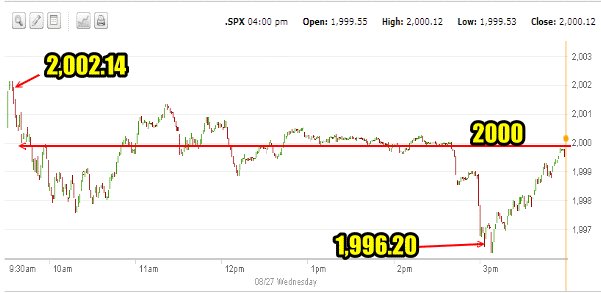
The morning once again opened with a sharp small bounce which ended up being the high for the day at 2002.14. From there the market promptly pulled back below 2000 to just below 1998. A late morning rally moved the market back over the 2000 level by failed to recapture the morning high. A third rally was lower than the first and that set the remaining tone as the afternoon saw very little volatility until late in the day when the market dropped to its low of 1996.20. This brought in the “buy the dips” crowd who jumped at the chance for “cheaper” stocks and they pushed the market right back to 2000 for the close. All in all a reasonably quiet day for the index with not a very wide swing up or down but more a sideways action.
SPX Intraday one minute chart for Aug 27 2014
Advance Declines For August 27 2014
Volume today continued to be low with just 2.3 billion shares traded. 53% of all volume was up with 45% down. 55% of all stocks were advancing and once again the bulls stayed well in charge with 148 new high and just 8 new lows. Again another day of profit-taking but really nothing to be concerned about with numbers like these.
Market Direction Closings For August 27 2014
The S&P closed at 2000.12 up 0.10. The Dow closed at 17,122.01 up 15.31. The NASDAQ closed at 4569.62 down 1.02 marking a flat day for all the indexes.
The Russell 2000 IWM ETF fell 29 cents to close at 116.51.
Market Direction Technical Indicators At The Close of August 27 2014
Let’s review the market direction technical indicators at the close of August 27 2014 on the S&P 500 and view the market direction outlook for August 28 2014.

market direction technical analysis for Aug 27 2014
Stock Chart Comments: The most important aspect of the present market is still the 1975 level. Profit-taking continued today but the little dip in the afternoon was quickly bought into. Investors continue to play the “buy the dip” game.
1975, 1956 Support: Both are light support and both may be tested in coming days but for the time being stocks look set to continue to move higher. 1975 is the more significant valuation at this point.
Strong Support Levels are at 1870 and 1840 (no longer shown). At present I am not expecting any break of either of these levels.
The other two support levels not shown in the chart above are 1775 and 1750. I have explained that these two are critical support for the present bull market. While 1775 is important it is 1750 that is now the bottom line.
A break of 1750 would mark a severe correction of more than 12.7% from the most recent high. This would be the biggest correction since April 2012. A pull-back of that size would definitely stun investors at this point and it is not something I am anticipating as there are no signs of any impending correction of that magnitude.
Momentum: For Momentum I am using the 10 period. Momentum has been the best indicator, replacing MACD as the most accurate indicator. Momentum is positive and sideways.
MACD Histogram: For MACD Histogram, I am using the Fast Points set at 13, Slow Points at 26 and Smoothing at 9. MACD (Moving Averages Convergence / Divergence) issued buy signal on Friday August 15. MACD remains positive but is turning sideways.
Ultimate Oscillator: The Ultimate Oscillator settings are: Period 1 is 5, Period 2 is 10, Period 3 is 15, Factor 1 is 4, Factor 2 is 2 and Factor 3 is 1. These are not the default settings but are the settings I use with the S&P 500 chart set for 1 to 3 months. The Ultimate Oscillator is no longer heavily overbought and is quickly losing the overbought state.
Rate of Change: Rate Of Change is set for a 21 period. Today the Rate Of Change pushed higher with a reading of 1.53. This indicates that in the profit-taking today new money was coming into stocks and buyers were interested in picking up shares despite the market being at 2000. Today the Rate Of Change indicator shows the exact same reading as yesterday.
Slow Stochastic: For the Slow Stochastic I use the K period of 14 and D period of 3. As the Slow Stochastic tries to predict the market direction further out than just one day. The Slow Stochastic is signaling market direction is neutral and it is overbought.
Fast Stochastic: For the Fast Stochastic I use the K period of 20 and D period of 5. These are not default settings but settings I set for the 1 to 3 month S&P 500 chart when it is set for daily. The Fast Stochastic is signaling down for stocks and it too is overbought.
Market Direction Outlook And Strategy for August 28 2014
Signals are a bit mixed by the close today which might be an indication that a harder move lower could be in the works for Thursday or Friday. Momentum is dropping off, MACD is pulling back slightly, the Ultimate Oscillator is dropping from the extreme overbought condition, the Rate Of Change is trending sideways without any clear signal higher, the Slow Stochastic is neutral and the Fast Stochastic is signaling lower with a somewhat stronger signal.
Overall all of this points to a lower day for Thursday. All of this could add up to a few more trades. I did not get filled on all the trades I was attempting from yesterday’s 10 trades for the last week of August article. That might happen on Thursday.
The outlook then is for a lower close on Thursday but remember that most of the indicators are positive and while they may be lackluster in their readings, they are still positive so stocks could surprise with a bounce attempt so keep a watch for that to possibly develop but looking at the market at the close, I would expect more selling tomorrow and a negative close.
Stay FullyInformed With Email Updates
Market Direction Internal Links
Profiting From Understanding Market Direction (Articles Index)
Understanding Short-Term Signals
Market Direction Portfolio Trades (Members)