
Prior Trading Day Summary
On Tue Mar 3 2026 stock markets opened considerably lower. The SPX opened at 6710, the lowest open since November. Buyers waited for a short period and then commenced rummaging through beaten down stocks. Not all stocks were being bought. The SPX closed down 65 points to 6816, well off the lows of the day but at the 100 day moving average which is bearish. The SPX saw volume jump to 6.5 billion shares traded with 75% of all stocks on the index moving lower by the close.
The NASDAQ lost 232 points to close at 22516 which was well off the low for the day. Volume rose by 1.5 billion shares traded to 10 billion. New lows rose well above new highs with 292 new lows and 61 new highs. By the close 71% of stocks were falling on the NASDAQ.
While much of the selling was related to concerns of the Iran conflict, some of the selling was also caused by continued private credit worries resulting in large redemptions from companies like Blackrock.
Let’s review the SPX closing technical indicators from Tue Mar 3 2026 to see what we should expect for Wed Mar 4 2026.
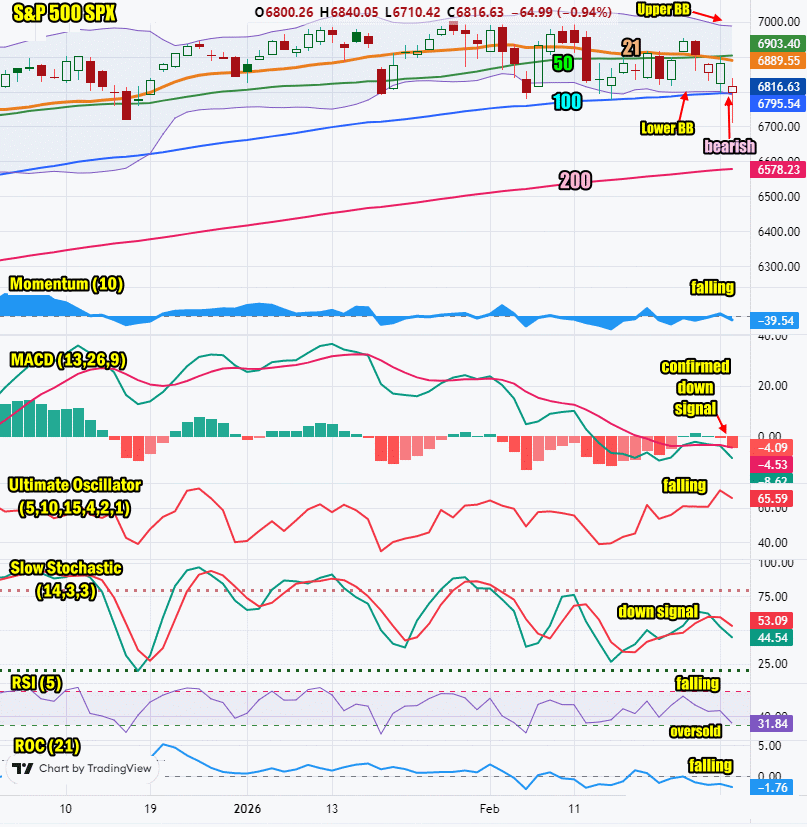
Stock Market Outlook: SPX Closing Chart For Tue Mar 3 2026
The index closed below the 21 and 50 day moving average. It reached the 100 day and opened below it before recovering. This is bearish.
The closing candlestick is bearish for Wednesday with a long shadow which signals more downside lies ahead for the index.
The 21 day moving average is falling and closed at 6889. It fell below the 50 day moving average issuing a down signal. This is bearish.
The 50 day moving average is rising and closed at 6903 but with the 21 day below the 50 day, this is also bearish.
The 100 day moving average is unchanged and closed at 6795 which is bearish.
The 200 day moving average is rising and closed at 6578 which is bullish.
The Lower Bollinger Band is falling and is below the 100 day moving average which is bearish. The Upper Bollinger Band is falling which is bearish.
The SPX chart is more bearish than bullish for Wednesday. The moving averages are showing the index as slipping lower.
SPX Stock Market Outlook review of Tue Mar 3 2026
Stock Market Outlook: Technical Indicators Review
Momentum: Momentum is falling and negative. This is bearish.
|
MACD Histogram: MACD (Moving Averages Convergence / Divergence) issued a down signal on Mon Mar 2 2026. On Tue Mar 3 2026 the down signal was strongly confirmed.
|
Ultimate Oscillator: The Ultimate Oscillator is falling which is bearish.
|
Slow Stochastic: The Slow Stochastic has a down signal in place which is bearish.
|
Relative Strength Index: The RSI signal has a down signal in place and is nearing oversold. This is bearish.
|
| Rate of Change: The rate of change is falling and signaling a lower close for today. Settings: Rate Of Change is set for a 21 period. This indicator looks back 21 days and compares price action from the past to the present. With the Rate Of Change, prices are rising when signals are positive. Conversely, prices are falling when signals are negative. As an advance rises, the Rate Of Change signal should also rise higher, otherwise the rally is suspect. A decline should see the Rate Of Change fall into negative signals. The more negative the signals the stronger the decline. |
Stock Market Outlook: Support and Resistance Levels |
| 7025 is resistance |
| 7000 is resistance |
| 6950 is resistance |
| 6925 is resistance |
| 6900 is resistance |
| 6875 is resistance |
| 6850 is support |
| 6800 is support |
| 6775 is support |
| 6750 is support |
| 6725 is support |
| 6700 is support |
| 6675 is support |
| 6650 is support |
| 6625 is support |
| 6600 is support |
Stock Market Outlook for Wed Mar 4 2026
With the SPX closed at 6817 on Tuesday the SPX chart is filled with bearish signals as well as down signals. The breaking through the 100 day moving average on Tuesday morning is concerning and usually signals more downside before a bounce can be expected. Overall the SPX chart looks poor and the confirmation of the MACD down signal is a strong indicator that more downside should be expected. Wednesday will end lower unless something dramatic and positive happens with the Iran conflict and at present that seems unlikely.
Continue to stay cautious while events unfold in the ongoing Iran conflict and protect capital. It is never a “bad idea” to protect capital by not committing it at uncertain times. We should have a better idea on how the conflict will impact stocks, as the week unfolds. Remember on Friday we get the February unemployment report. That often can move markets on its own.
Fed’s Beige Book is released today at 2:00 PM. I am not expecting anything “new” that will move markets when it is released.
Potential Economic and Political Market Moving Events
Monday:
9:45 S&P final US Manufacturing index came in as estimated at 51.6
10:00 ISM manufacturing for February was better than estimated, coming in at 52.4%
Auto sales are estimated to come in at 14.9 million up from 14.8 million prior
Tuesday:
No reports to be released
Wednesday:
8:15 ADP employment is estimated to more than double to 48,000 for Feb
9:45 S&P final US services PMI is estimated to fall to -52
10:00 ISM services are estimated to slip slightly to 53.5% from 53.8% prior
2:00 Fed’s Beige Book