

Prior Trading Day Summary
On Wed May 27 2026 oil prices dropped again and many chip stocks rose strongly. This helped the indexes to rally intraday but then dip at the end of the day.
The S&P rose just 1 points closing at 7520 but intraday it was up to 7530. Volume was 5.6 billion shares. By the close the number of stocks rising dropped to 51% of the index.
The NASDAQ rose 18 points to close at 26,674 but intraday the index reached 26715 just 10 points below its all-time high. Volume slipped to 9.5 billion and only 46% of stocks on the index were still climbing by the close.
Many stocks rallied strongly on Wednesday but weakness did creep in as the day came to a close. Investors are preparing for the latest inflation report due out on Thursday.
Let’s review the closing technical indicators from Wed May 27 2026 to see what they predict for Thu May 28 2026.
Stock Market Outlook: SPX Closing Chart For Tue May 26 2026
The index closed above all major moving averages and came close to the Upper Bollinger Band intraday. This is bullish.
The closing candlestick is bullish for Thursday. There are two shallow candlesticks at the close which predicts we will see a choppy day on Thursday.
The 21 day moving average is rising and closed at 7361. This is bullish.
The 50 day moving average is rising and closed at 7022. This is bullish.
The 100 day moving average is rising and closed at 6996. Thit is bullish.
The 200 day moving average is rising and closed at 6782. This is bullish.
The Lower Bollinger Band is climbing which is bullish at present. The Upper Bollinger Band is climbing which is bullish.
The SPX chart is more bullish than bearish for Thursday.
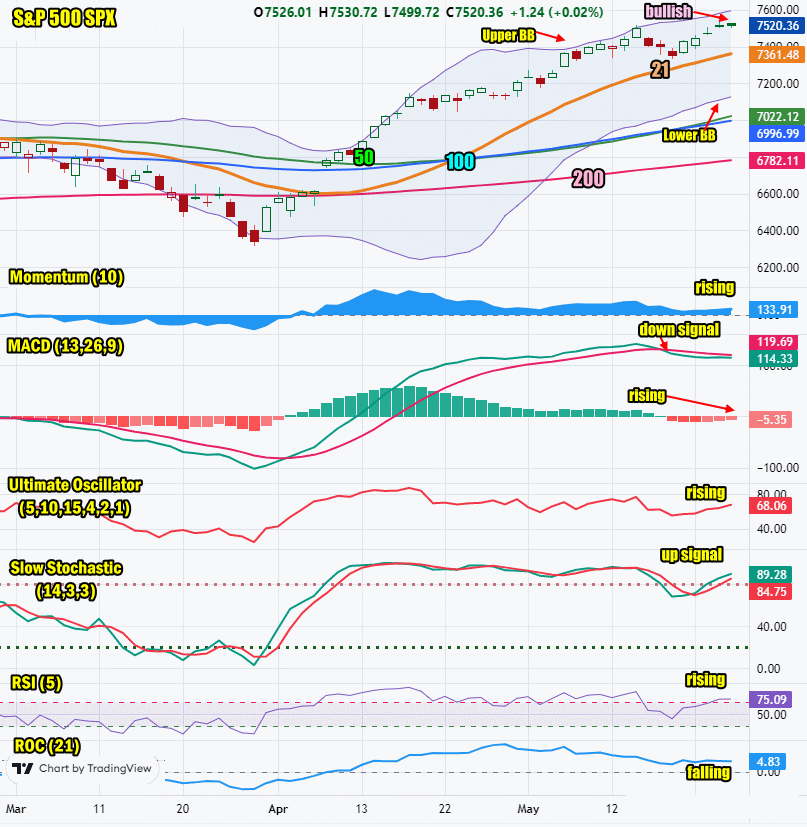
SPX Stock Market Outlook review of Wed May 27 2026
Stock Market Outlook: Technical Indicators Review
Momentum: Momentum is rising. This is bullish.
|
MACD Histogram: MACD (Moving Averages Convergence / Divergence) issued a down signal on Tue May 19 2026. On Wed May 27 2026 the down signal gained some strength but we could still see a new up signal shortly.
|
Ultimate Oscillator: The Ultimate Oscillator is rising which is bullish.
|
Slow Stochastic: The Slow Stochastic has an up signal in place.
|
Relative Strength Index: The RSI signal is rising which is bullish.
|
| Rate of Change: The rate of change is falling and signaling a lower close is likely. Settings: Rate Of Change is set for a 21 period. This indicator looks back 21 days and compares price action from the past to the present. With the Rate Of Change, prices are rising when signals are positive. Conversely, prices are falling when signals are negative. As an advance rises, the Rate Of Change signal should also rise higher, otherwise the rally is suspect. A decline should see the Rate Of Change fall into negative signals. The more negative the signals the stronger the decline. |
Stock Market Outlook: Support and Resistance Levels |
| 7550 is resistance |
| 7500 is resistance |
| 7450 is resistance |
| 7425 is resistance |
| 7400 is resistance |
| 7370 is resistance |
| 7350 is resistance |
| 7280 is resistance |
| 7250 is resistance |
| 7230 is resistance |
| 7200 is support |
| 7175 is support |
| 7150 is support |
| 7125 is support |
| 7100 is support |
| 7050 is support |
| 7000 is support |
| 6950 is support |
| 6900 is support |
Stock Market Outlook for Thu May 28 2026
For Thu May 28 2026 investors get a slew of economic reports including the latest PCE numbers which many analysts believe will show that inflation is rising in the economy.
While the market direction will be primarily determined by the latest PCE numbers, the technical indicators are still very bullish. Only the Rate Of Change indicator has reverted and is showing a dhown day for Thursday.
Potential Economic and Political Market Moving Events
Monday:
Memorial Day holiday
Tuesday:
9:00 S&P Case-Shiller home price index fell to 0.7%
10:00 Consumer confidence was higher than estimated at 93.1
Wednesday:
No economic data released today
Thursday:
8:30 GDP for first quarter is estimated at 2.0% unchanged
8:30 Personal income for April is estimated to dip to 0.4% from 0.6% prior
8:30 Personal Spending for April is estimated to have dropped to 0.5% from 0.9% prior
8:30 PCE Index for April is estimated at 0.5%, down from 0.7% prior
8:30 PCE year-over-year is estimated to have risen to 3.3% from 3.2% prior
8:30 Weekly Initial Unemployment Insurance Claims are estimated to rise to 213,000 from 209,000 prior
8:30 Durable goods orders are estimated to rise to 3.5% from 0.8% prior
10:00 New home sales are estimated to fall to 663,000 from 682,000 prior