FullyInformed.com
Generic filters
Exact matches only
Search in title
Search in content
Search in excerpt

Stock Market Outlook for Tue Sep 26 2023 – Weakness But Higher Close Expected

Sep 26, 2023 | Stock Market Outlook

Stock Market Outlook weakness but higher close

Prior Trading Day Summary

On Monday, stocks rose fueled primarily by an extremely oversold condition. Oil prices continued to climb as did treasury yields which ended the day at their highest level since 2007.

Despite all this, investors picked through stocks and managed to close the indexes higher.

The SPX rose a modest 17 points to close at 4337 while the NASDAQ rose 59 points to close at 13,710.

Volumes were poor on Monday but the SPX had 249 new lows, the highest number since May 4.

The NASDAQ had 433 new 52 week lows the second highest number in September and third highest since May 4.

Let’s review the closing technical indicators from Mon Sep 25 2023 to see what to expect for Tue Sep 26 2023.


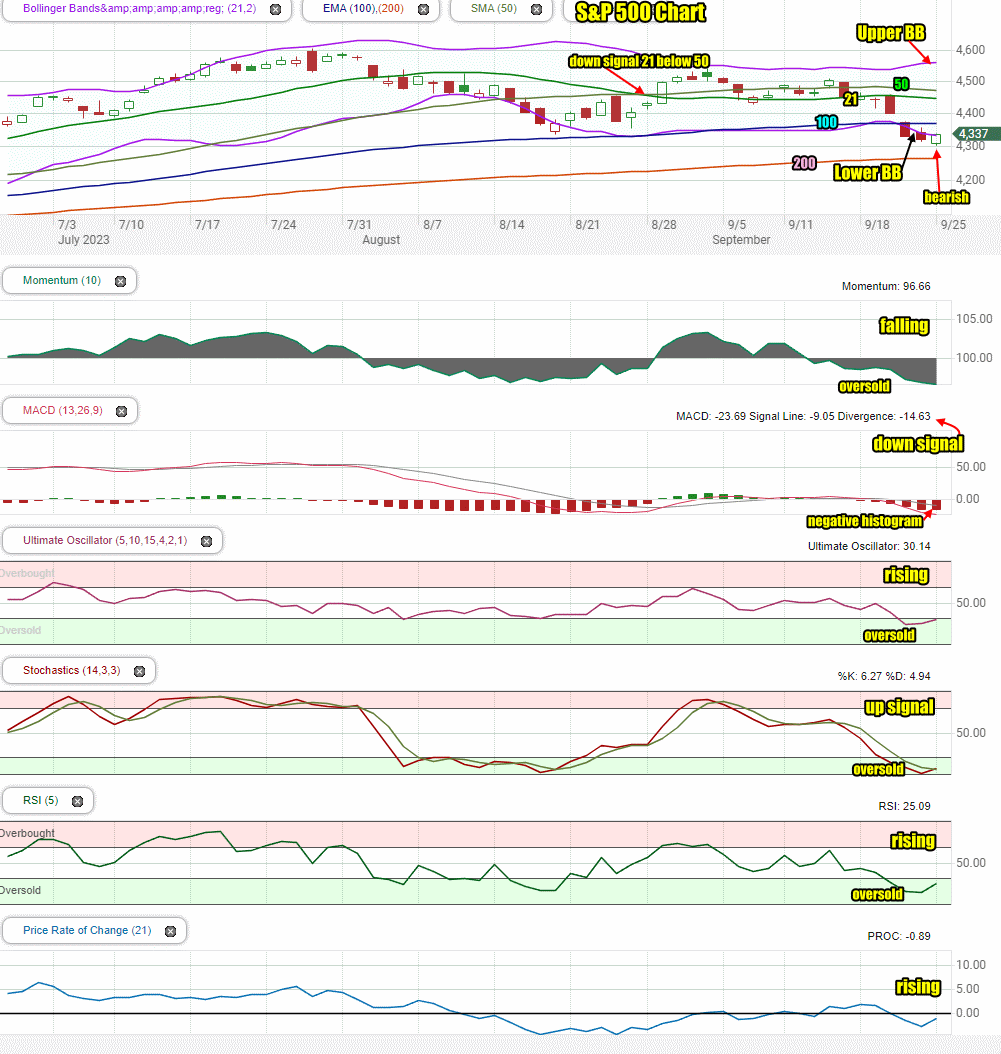
Stock Market Outlook: SPX Closing Chart For Mon Sep 25 2023

The index closed below the 50, 21 and 100 period moving averages for a third day which is bearish. The closing candlestick is also bearish but once again signals a potential bounce for Tuesday. The closing candlestick closed at the Lower Bollinger Band  which is bearish but is also often a point where a bounce occurs in a downtrend.

The 50 period and 21 period moving averages are falling which is bearish. The 200 period moving averages are continuing to climb which is bullish. The 100 period moving average is starting to turn sideways which is neutral at present.

The Lower Bollinger Band is turning sideways which is bearish. The Upper Bollinger Band is rising which is bullish. Overall the SPX chart is still signaling that this is a correction and nothing more. We will soon see if that prediction is true.

Stock Market Outlook review of Mon Sep 25 2023


Stock Market Outlook: Technical Indicators Review

Momentum: Momentum is falling sharply and negative. It is signaling extremely oversold.

  • Settings: For momentum I use a 10 period when studying market direction.
MACD Histogram: MACD (Moving Averages Convergence / Divergence) issued a down signal on Mon Sep 18. On Monday the down signal was stronger again.

  • Settings: For MACD Histogram, I am using the Fast Points set at 13, Slow Points at 26 and Smoothing at 9. 
Ultimate Oscillator: The Ultimate Oscillator is rising and negative. It is oversold.

  • Settings: The Ultimate Oscillator settings are: Period 1 is 5, Period 2 is 10, Period 3 is 15, Factor 1 is 4, Factor 2 is 2 and Factor 3 is 1. These are not the default settings but are the settings I use with the S&P 500 chart set for 1 to 3 months.
Slow Stochastic: The Slow Stochastic has n up signal in place and is extremely oversold.

  • Settings: For the Slow Stochastic I use the K period of 14 and D period of 3. The Slow Stochastic tries to predict the market direction further out than just one day.
Relative Strength Index: The RSI signal is rising and negative. It is oversold.

  • Settings: The relative strength index is set for a period of 5 which gives it 5 days of market movement to monitor.  It is often the first indicator to show an overbought or oversold signal.
Rate of Change: The rate of change signal is rising and negative.

  • Settings: Rate Of Change is set for a 21 period. This indicator looks back 21 days and compares price action from the past to the present. With the Rate Of Change, prices are rising when signals are positive. Conversely, prices are falling when signals are negative. As an advance rises, the Rate Of Change signal should also rise higher, otherwise the rally is suspect. A decline should see the Rate Of Change fall into negative signals. The more negative the signals the stronger the decline.

Stock Market Outlook: Support and Resistance Levels

4600 is resistance
4575 is resistance
4550 is resistance
4525 is resistance
4500 is resistance
4485 is resistance
4470 is resistance
4450 is resistance
4435 is support
4420 is support
4400 is support
4390 is support
4370 is support
4350 is support
4330 is support
4325 is support
4300 is good support


Stock Market Outlook for Tue Sep 26 2023 

For Tuesday, the technical indicators are still negative but a number of them are rising. They are however still signaling oversold. For the bulls that could mean a further bounce attempt today.

The day could open flat to slightly positive but then move lower to test 4325 before attempting another rally. The close is expected to be a bit higher.


Potential Economic and Political Market Moving Events

This week the reports are lighter which could assist the bulls. The most telling report is the PCE Index on Friday.

Tuesday:

9:00 S&P Case-Shiller home price index is expected to be positive 0.3%, up from -1.2% prior

10:00 New home sales are expected to dip to 695,000 from 714,000

10:00 Consumer confidence is estimated at 105.5 down just slightly from 106.1 prior


Recent Outlooks

Stock Market Outlook For Wed Jun 11 2025 – A Little Weakness But Still Higher

Prior Trading Day Summary: On Tue Jun 10 2025 the indexes continued to climb but in a choppy day. By the close the SPX was up 33 points to 6038. Volume rose by 200 million shares to 4.9 billion and …

Morning Investing Strategy Notes for Tue Jun 10 2025

For FullyInformed Members the morning Investing Strategy Notes for Tue Jun 10 2025 review the outlook Tuesday after Monday’s relatively flat close. Stocks discussed today include Robin Hood Stock (HOOD), Apple Stock (AAPL), Boeing Stock (BA), Chewy Stock (CHWY) and …

Stock Market Outlook For Tue Jun 10 2025 – Choppy – Dips Likely But Higher

Prior Trading Day Summary: On Mon Jun 9 2025 indexes closed slightly positive in what was a choppy session. For much of the day the SPX was trading above 6010 but the final hour saw stocks fall back. The SPX …

Morning Investing Strategy Notes for Mon Jun 9 2025

For FullyInformed Members the morning Investing Strategy Notes for Mon Jun 9 2025 review the outlook for the start of the second week of June which, historically, is poor for stocks.. Stocks discussed today include SPY ETF, TQQQ ETF and …

Stock Market Outlook For Mon Jun 9 2025 – Choppy With Bias Higher

Prior Trading Day Summary: On Fri Jun 6 2025, the May Non-Farm Payroll Numbers were better than economists had estimated and the indexes moved higher. The S&P climbed 61 points to end the day at 6000. This is the first …

Morning Investing Strategy Notes for Fri Jun 6 2025

For FullyInformed Members the morning Investing Strategy Notes for Fri Jun 6 2025 review the outlook for the May Non-Farm Payroll Numbers. Stocks discussed today include Broadcom Stock (AVGO), DocuSign Stock (DOCU) and more. The morning Investing Strategy Notes are …

Stock Market Outlook For Fri Jun 6 2025 – All About May Jobs Numbers

Prior Trading Day Summary: On Thu Jun 5 2025 stocks were primarily under selling pressure after coming within a point of reaching 6000 over the lunch hour. Arguments between President Trump and Elon Musk took center stage, holding investors focus …

Morning Investing Strategy Notes for Thu Jun 5 2025

For FullyInformed Members the morning Investing Strategy Notes for Thu Jun 5 2025 review the outlook the day ahead of May’s Non-Farm Payroll Numbers being released. Stocks discussed today include MongoDB Stock (MDB), PepsiCo Stock (PEP),  Microsoft Stock (MSFT), Broadcom …

Stock Market Outlook For Thu Jun 5 2025 – Weakness – Dips Likely – Still Bullish

Prior Trading Day Summary: On Wed Jun 4 2025 stocks opened lower as ADP numbers came in far below estimates which spooked investors. By the close, investors had regained Tuesday’s close. The SPX closed unchanged at 5971 on 4.8 billion …

Morning Investing Strategy Notes for Wed Jun 4 2025

For FullyInformed Members the morning Investing Strategy Notes for Wed Jun 4 2025 review the outlook for the remainder of the week. Stocks discussed today include NVIDIA Stock (NVDA), Wells Fargo Stock (WFC), SQQQ ETF, IWM ETF, Crowdstrike Stock (CRWD), …

Stock Market Outlook For Wed Jun 4 2025 – Mixed Outlook But Still Bullish

Prior Trading Day Summary: On Tue Jun 3 2025 stocks opened lower and spent the day rallying to once again end positive. The SPX rose 34 points to close at 5970. Volume jumped to 5.1 billion and new highs came …

Morning Investing Strategy Notes for Tue Jun 3 2025

For FullyInformed Members the morning Investing Strategy Notes for Mon Jun 2 2025 review the outlook for Tuesday following Monday’s late afternoon rally. Stocks discussed today include SQQQ ETF, IWM ETF, Apple Stock (AAPL), and more. The morning Investing Strategy …

Stock Market Outlook For Tue Jun 3 2025 – Weakness Continuing

Prior Trading Day Summary: On Monday stocks spent the day recovering from a morning sell-off and by the late afternoon it was up 24 points. The close saw the SPX at 5935. Volume was low at 4.9 billion shares but …

Morning Investing Strategy Notes for Mon Jun 2 2025

For FullyInformed Members the morning Investing Strategy Notes for Mon Jun 2 2025 review the outlook for June looking at past years as well as the current one. Stocks discussed today include SQQQ ETF, IWM ETF, Signet Jewelers Stock (SIG), …

Subscribe For The Latest News