
 Prior Trading Day Summary
On Mon May 11 2026 indexes closed higher but the rally narrowed as the statistics show.
The S&P rose 14 points to close at 7412, another new all-time high. Volume climbed to 6 billion but by the close 59% of all stocks were moving lower.
The NASDAQ rose 27 points to close at 26,274 marking another new high. Volume saw its best day since Jan 16, with 12.4 billion shares trading hands. By the close 54% of all stocks were falling. .
With inflation numbers due out on Tuesday before the open, stocks should start the day under some selling pressure.
Let’s review the closing technical indicators from Mon May 11 2026 to see what they predict for Tue May 12 2026.
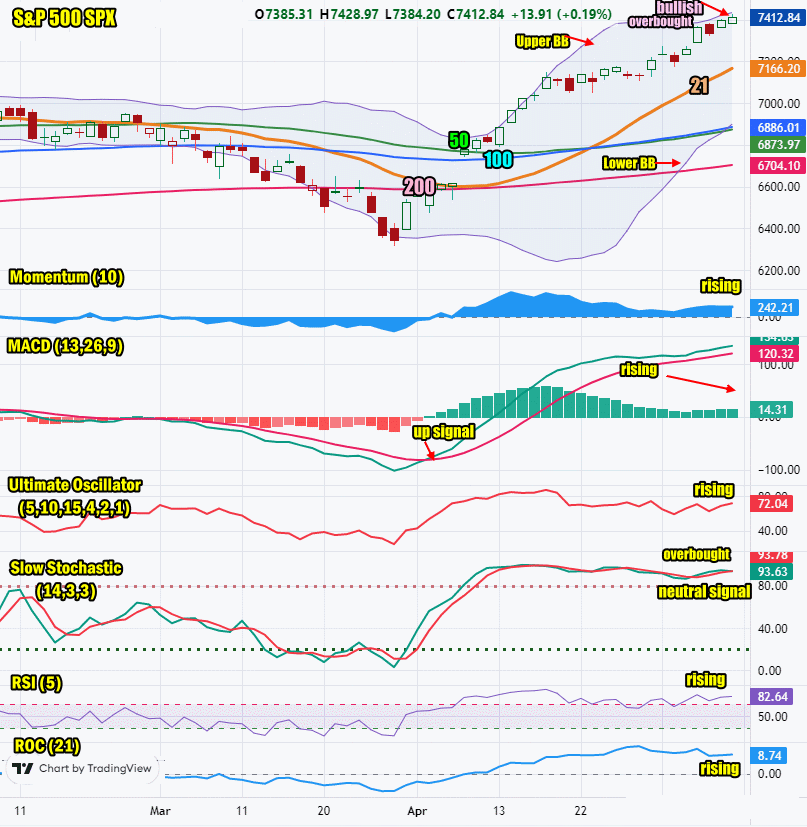
Stock Market Outlook: SPX Closing Chart For Mon May 11 2026
The index closed above all major moving averages and at the Upper Bollinger Band. This is bullish.
The closing candlestick is bullish for Tuesday and continues to signal stocks are overbought.
The 21 day moving average is rising sharply and closed at 7166. This is bullish.
The 50 day moving average is rising and closed at 6873. This is bullish but below the 100 day moving average.
The 100 day moving average is rising and closed at 6886. Each day that the 100 day is above the 50 day is a sign of underlying weakness to the uptrend.
The 200 day moving average is rising and closed at 6704 This is bullish.
The Lower Bollinger Band is still climbing and closed above the 100 day moving average. This is bearish. The Upper Bollinger Band is moving higher which is bullish.
The SPX chart is more bullish than bearish for Tuesday despite being overbought.
SPX Stock Market Outlook review of Mon May 11 2026
Stock Market Outlook: Technical Indicators Review
Momentum: Momentum is rising. This is bullish.
|
MACD Histogram: MACD (Moving Averages Convergence / Divergence) issued an up signal on Fri Apr 7 2026. On Mon May 11 2026 the up signal gained strength which is bullish.
|
Ultimate Oscillator: The Ultimate Oscillator is rising which is bullish.
|
Slow Stochastic: The Slow Stochastic has an up signal in place. It is extremely overbought. It is at levels where a pullback should be expected.
|
Relative Strength Index: The RSI signal is rising and is at overbought readings.
|
| Rate of Change: The rate of change is rising and signaling a higher close is likely. Settings: Rate Of Change is set for a 21 period. This indicator looks back 21 days and compares price action from the past to the present. With the Rate Of Change, prices are rising when signals are positive. Conversely, prices are falling when signals are negative. As an advance rises, the Rate Of Change signal should also rise higher, otherwise the rally is suspect. A decline should see the Rate Of Change fall into negative signals. The more negative the signals the stronger the decline. |
Stock Market Outlook: Support and Resistance Levels |
| 7425 is resistance |
| 7400 is resistance |
| 7370 is resistance |
| 7350 is resistance |
| 7280 is resistance |
| 7250 is resistance |
| 7230 is resistance |
| 7200 is resistance |
| 7190 is resistance |
| 7175 is resistance |
| 7150 is resistance |
| 7125 is resistance |
| 7100 is support |
| 7050 is support |
| 7000 is support |
| 6950 is support |
| 6900 is support |
| 6875 is support |
| 6850 is support |
| 6800 is support |
Stock Market Outlook for Tue May 12 2026
For Tue May 12 2026 we get the latest read on inflation, before the open. A stronger number will see stocks open lower. The futures early morning are pointing to a higher day on Tuesday but the technical indicators are warnings of dips today with a probable lower close.
Potential Economic and Political Market Moving Events
Monday:
10:00 Existing home sales for April came in lower than estimated at 4.02 million.
Tuesday:
8:30 The Consumer Price Index is revealed. Estimates are for a drop to 0.6% versus 0.9% prior
830: CPI year-over-year is estimated to rise to 3.8% from 3.3% prior – this will be bearish for stocks
8:30 Core CPI is estimated at 0.3% versus 0.2% prior
8:30 Core CPI year-over-year is estimated at 2.7% versus 2.6% prior