

Prior Trading Day Summary
On Monday the SPX and NASDAQ indexes made new closing highs again.
The SPX rose 8 points to close at 7173 on 4.8 billion shares traded. 52% of all stocks were rising by the close.
The NASDAQ rose 50 points to close at 24,887 with 45% of stocks on the index rising on 8.2 billion shares traded.
Let’s review the closing technical indicators from Mon Apr 27 2026, to see what they predict for Tue Apr 28 2026.
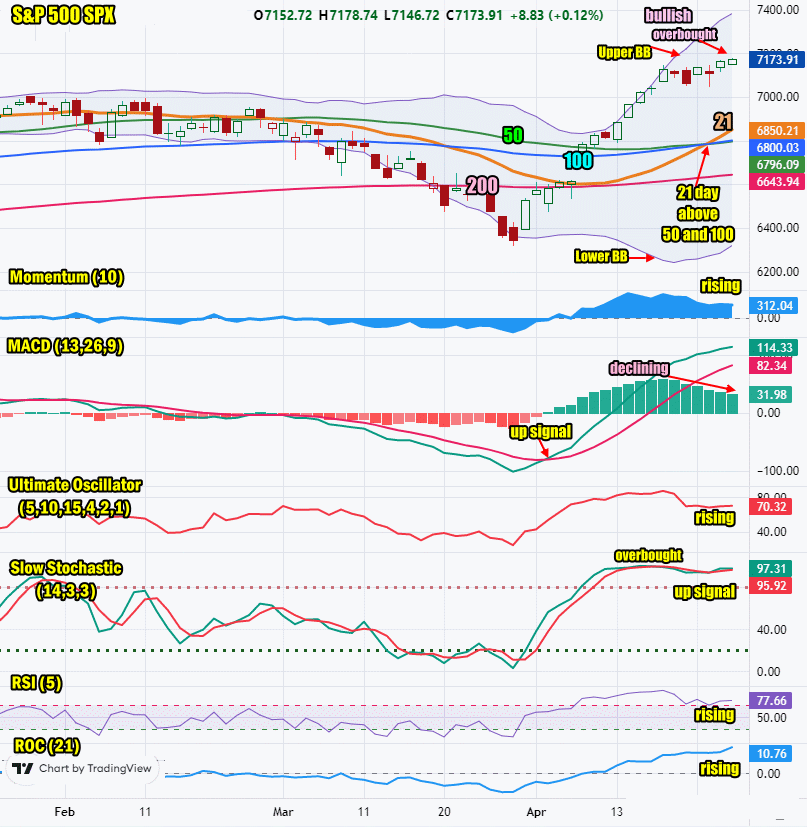
Stock Market Outlook: SPX Closing Chart For Mon Apr 27 2026
The index closed above all major moving averages but inside the Upper Bollinger Band for a sixth day. The index is climbing which is bullish.
The closing candlestick is bullish for Tuesday. The index closed just a handful of points below the high but often this signals some dips today.
The 21 day moving average is rising sharply and closed at 6850. This is bullish and places the 21 day back above the 50 and 100 day moving averages.
The 50 day moving average is rising and closed at 6796. This is bullish but below the 100 day moving average.
The 100 day moving average is rising and closed at 6800. This is bullish.
The 200 day moving average is rising and closed at 6643. This is bullish.
The Lower Bollinger Band is turning higher which signals the high momentum rally is ended. The Upper Bollinger Band is rising which is bullish.
The SPX chart is more bullish than bearish and the 21 day moving average climbing above the 50 and 100 day moving averages is an excellent up signal. The week looks like another winner for the indexes.
SPX Stock Market Outlook review of Mon Apr 27 2026
Stock Market Outlook: Technical Indicators Review
Momentum: Momentum is rising. This is bullish as the overbought condition continues to erode.
|
MACD Histogram: MACD (Moving Averages Convergence / Divergence) issued an up signal on Fri Apr 7 2026. On Mon Apr 27 2026 the up signal lost more strength. You can clearly see in the chart above that the MACD indicator is pulling back every day. If this does not change the index will see weakness shortly and possibly fall lower.
|
Ultimate Oscillator: The Ultimate Oscillator is rising.
|
Slow Stochastic: The Slow Stochastic has a weak up signal in place. It is extremely overbought. It is at levels where a pullback should be expected.
|
Relative Strength Index: The RSI signal is rising and bullish. It is back at overbought levels.
|
| Rate of Change: The rate of change is rising and signaling a higher close is likely. Settings: Rate Of Change is set for a 21 period. This indicator looks back 21 days and compares price action from the past to the present. With the Rate Of Change, prices are rising when signals are positive. Conversely, prices are falling when signals are negative. As an advance rises, the Rate Of Change signal should also rise higher, otherwise the rally is suspect. A decline should see the Rate Of Change fall into negative signals. The more negative the signals the stronger the decline. |
Stock Market Outlook: Support and Resistance Levels |
| 7190 is resistance |
| 7175 is resistance |
| 7150 is resistance |
| 7125 is resistance |
| 7100 is resistance |
| 7050 is resistance |
| 7000 is resistance |
| 6950 is resistance |
| 6900 is resistance |
| 6850 is resistance |
| 6830 is resistance |
| 6800 is support |
| 6780 is support |
| 6750 is support |
| 6735 is support |
| 6700 is support |
| 6675 is support |
| 6650 is support |
| 6625 is support |
| 6600 is support |
Stock Market Outlook for Tue Apr 28 2026
For Tuesday the technical indicators are still overbought. The rally is winding down even though the SPX is still climbing. Another higher close is expected today but there are signs the index will see a few down days shortly.
Potential Economic and Political Market Moving Events
Monday:
No reports are released
Tuesday:
9:00 Case-Shillier home price index is expected to remain unchanged at 1.2%
10:00 Consumer confidence is estimated to fall to 89.1 from 91.8 prior.