
Prior Trading Day Summary
On Thu Jun 25 2026 stocks attempted a bounce with Micron Technology Stock (MU) doing most of the lifting. By the close however the broader market was moving opposite to Micron Technology Stock (MU) with Apple Stock (AAPL) pulling stocks lower. As well inflation data showed a stronger move higher than anticipated and that also weighed on stocks.
On Thursday the SPX fell less than 1 point by the close to end the day at 7357 on 5.6 billion shares traded. Despite the small loss, 54% of al stocks were rising by the close which was slightly better than Wednesday’s close.
The NASDAQ lost 118 points to close at 25,358 on 15.9 billion shares traded. By the close 45% of all stocks were still rising on the index, the same percentage as we saw on Wednesday.
With the rally stalled on Thursday, stocks looked weak after the close and futures showed more selling is likely on Friday to end the week.
Let’s review the closing technical indicators from Thu Jun 25 2026 to see what they predict for Fri Jun 26 2026.
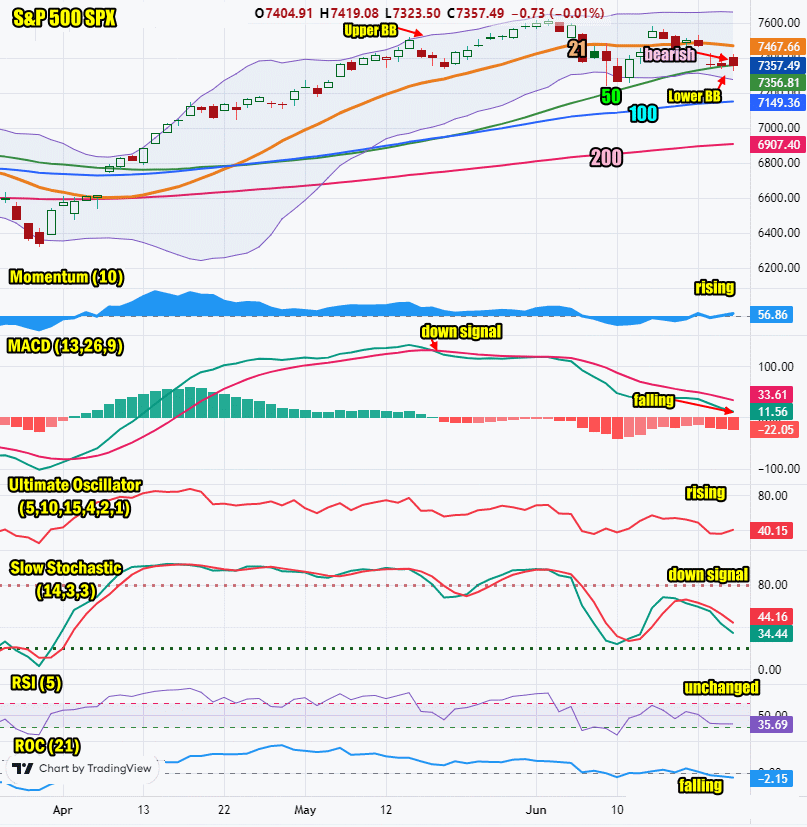
Stock Market Outlook: SPX Closing Chart For Thu Jun 25 2026
The index ended the day at the 50 day moving average again on Thursday. This is bearish. A break below is likely after 3 days without being able to move higher off the moving average.
The closing candlestick is bullish for Thursday. A long shadow appears on Wednesday’s closing candlestick for a second day. Normally a bounce should be expected on the second day.
The 21 day moving average is falling and closed at 7467. This is bearish.
The 50 day moving average is rising and closed at 7356. This is bullish.
The 100 day moving average is rising and closed at 7149. This is bullish.
The 200 day moving average is rising and closed at 6907. This is bullish.
The Lower Bollinger Band is falling and below the 50 day moving average. This is bearish at present. The Upper Bollinger Band is trending sideways which is bearish. If it turns lower, this will be a signal that the index will be moving lower and probably entering another correction.
The SPX chart is more bearish for Fri Jun 26 2026 and is signaling a lower close.
SPX Stock Market Outlook review of Thu Jun 25 2026
Stock Market Outlook: Technical Indicators Review
Momentum: Momentum is rising and positive. This is bullish.
|
MACD Histogram: MACD (Moving Averages Convergence / Divergence) issued a down signal on Tue May 19 2026. On Thu Jun 25 2026 the down signal gained strength.
|
Ultimate Oscillator: The Ultimate Oscillator is rising which is bullish.
|
Slow Stochastic: The Slow Stochastic has a down signal in place. This is bearish.
|
Relative Strength Index: The RSI signal is unchanged which is neutral.
|
| Rate of Change: The rate of change is falling, signaling Friday will end lower. Settings: Rate Of Change is set for a 21 period. This indicator looks back 21 days and compares price action from the past to the present. With the Rate Of Change, prices are rising when signals are positive. Conversely, prices are falling when signals are negative. As an advance rises, the Rate Of Change signal should also rise higher, otherwise the rally is suspect. A decline should see the Rate Of Change fall into negative signals. The more negative the signals the stronger the decline. |
Stock Market Outlook: Support and Resistance Levels |
| 7600 is resistance |
| 7590 is resistance |
| 7570 is resistance |
| 7550 is resistance |
| 7500 is resistance |
| 7450 is resistance |
| 7425 is resistance |
| 7400 is resistance |
| 7370 is resistance |
| 7350 is support |
| 7300 is support |
| 7280 is support |
| 7250 is support |
| 7200 is support |
| 7175 is support |
| 7150 is support |
| 7125 is support |
| 7100 is good support |
| 7050 is good support |
| 7000 is stronger support |
Stock Market Outlook for Fri Jun 26 2026
For Friday the technical indicators are more bearish than bullish but there are no signs of an oversold market. A bounce therefore is unlikely. The latest inflation figures on Thursday show an economy that is heating up, not cooling off. Many investors believe the Fed may have to act before year-end and raise interest rates. At the same time, there are more analysts who believe the inflation spike will pullback and by year-end will be a lot lower. They see no need for the Fed to raise rates. You can review all the economic signals released on Thursday, below. They show the economy heating up including more jobs created and rising personal income and spending. All of this is usually inflationary.
For Friday watch for stocks to move lower. The week is expected to end negative.
Potential Economic and Political Market Moving Events
Monday:
No reports
Tuesday:
9:45 Jun Flash manufacturing PMI came in at 55.7 which was slightly ahead of the 55.3 prior
9:45 Jun Flash services PMI came in above estimates at 51.3 versus 50.9 prior.
Wednesday:
10:00 New home sales for May was lower than estimated, falling to 580,000 well below estimates of 632,000
4:00 Fed Board annual bank stress test results
Thursday:
8:30 Weekly Initial Unemployment Insurance Claims were better than estimated, coming in at 215,000
8:30 Personal income for May came in above estimates at 0.7%
8:30 Personal spending was also stronger than estimated, coming in at 0.7%
8:30 PCE Index is was lower than estimated at 0.4%
8:30 PCE year-over-year came in as estimated at 4.1% from 3.8% prior
8:30 Core PCE is came in as estimated at 0.3%
8:30 Core PCE year-over-year came in as estimated at 3.4% from 3.3% prior
8:30 Durable goods orders for May was worse than estimated coming in at -4.25%
8:30 GDP for first quarter came in above estimates at 2.1%
Friday:
8:30 Advanced economic indicators are estimated at -82.48
8:30 Wholesale inventories are estimated unchanged at 0.5%
8:30 Retail inventories are estimated unchanged at 0.7%