

Prior Trading Day Summary
On Tue May 26 2026 oil prices dropped and stocks continued their advance. The Dow Jones Index however closed lower.
The S&P rose 45 points closing at 7519 and intraday the index made a new all-time high when it reached 7539. Volume rose to 5.6 billion and by the close 66% of all stocks were rising.
The NASDAQ rose 312 points to close at 26,656. Intraday the index made a new all-time high reaching 26,725. Volume on the NASDAQ rose to 10 billion with 60% of all stocks rising on the index by the close.
Micron Technology Stock (MU) soared $144.88 for a gain of 19.29%. Micron Technology Stock (MU) reached one trillion market cap on Tuesday. UBS tripled its outlook for the price to better than $1600.
Let’s review the closing technical indicators from Tue May 26 2026 to see what they predict for Wed May 27 2026.
Thank You For Taking Advantage Of The Memorial Day Special
Thank you to all investors who took advantage of the membership sale over the past 4 days. Hour support of fullyinformed.com through your purchase or renewal of a membership is appreciated.
Stock Market Outlook: SPX Closing Chart For Tue May 26 2026
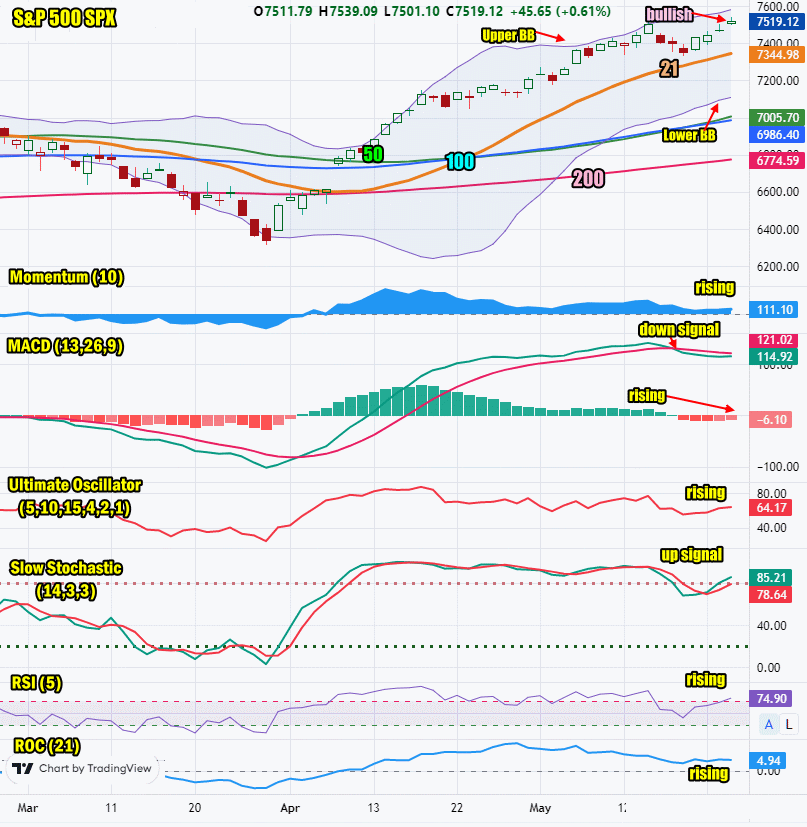
The index closed above all major moving averages and came close to the Upper Bollinger Band intraday. This is bullish.
The closing candlestick is bullish for Wednesday with a long shadow indicating some volatility and probably a dip or bounce on Wednesday.
The 21 day moving average is rising and closed at 7344. This is bullish.
The 50 day moving average is rising and closed at 7005. This is bullish.
The 100 day moving average is rising and closed at 6986. Thit is bullish.
The 200 day moving average is rising and closed at 6774. This is bullish.
The Lower Bollinger Band is climbing which is bullish at present. The Upper Bollinger Band is climbing which is bullish.
The SPX chart is more bullish than bearish for Wednesday.
SPX Stock Market Outlook review of Tue May 26 2026
Stock Market Outlook: Technical Indicators Review
Momentum: Momentum is rising. This is bullish.
|
MACD Histogram: MACD (Moving Averages Convergence / Divergence) issued a down signal on Tue May 19 2026. On Tue May 26 2026 the down signal lost strength and we could see a new up signal shortly.
|
Ultimate Oscillator: The Ultimate Oscillator is rising which is bullish.
|
Slow Stochastic: The Slow Stochastic has an up signal in place.
|
Relative Strength Index: The RSI signal is rising which is bullish.
|
| Rate of Change: The rate of change is rising and signaling a higher close is likely. Settings: Rate Of Change is set for a 21 period. This indicator looks back 21 days and compares price action from the past to the present. With the Rate Of Change, prices are rising when signals are positive. Conversely, prices are falling when signals are negative. As an advance rises, the Rate Of Change signal should also rise higher, otherwise the rally is suspect. A decline should see the Rate Of Change fall into negative signals. The more negative the signals the stronger the decline. |
Stock Market Outlook: Support and Resistance Levels |
| 7550 is resistance |
| 7500 is resistance |
| 7450 is resistance |
| 7425 is resistance |
| 7400 is resistance |
| 7370 is resistance |
| 7350 is resistance |
| 7280 is resistance |
| 7250 is resistance |
| 7230 is resistance |
| 7200 is resistance |
| 7190 is resistance |
| 7175 is support |
| 7150 is support |
| 7125 is support |
| 7100 is support |
| 7050 is support |
| 7000 is support |
| 6950 is support |
| 6900 is support |
| 6875 is support |
| 6850 is support |
| 6800 is support |
Stock Market Outlook for Wed May 27 2026
For Wed May 27 2026 the SPX technical indicators are predicting a dip intraday and a move still higher. A higher close is also expected.
Potential Economic and Political Market Moving Events
Monday:
Memorial Day holiday
Tuesday:
9:00 S&P Case-Shiller home price index fell to 0.7%
10:00 Consumer confidence was higher than estimated at 93.1
Wednesday:
No economic data released today