
Investors who follow my website know there are a multitude of market timing systems which investors have followed.
I prefer to keep watch on one of the better market timing systems I established which is based on the Weekly Initial Unemployment Insurance Claims. This article outlines how the Weekly Initial Unemployment Insurance Claims work as a market timing system. I have used this system for years and find it to be one of the more reliable systems.
June 18 2015 Outlook – Stay Invested
Despite the concerns over interest rates rising perhaps as early as September, my market timing system continues to advise that I should stay invested based on today’s Weekly Initial Unemployment Insurance Claims.
The number of Americans filing new claims for unemployment fell once again. This time claims fell by 12,000 to 267,000 for the period ending June 13. This is the lowest level since the week ending May 9 and was better than any of the forecasts by economists. Most predicted the number to come in at 277,000.
15 Straight Weeks Of Declines
This week marked the 15th unbroken week of jobless claims below 300,000 and numbers are now placing the past several months as among the best on record since 2000.
Market Timing System Says Stay Invested
The system you see below is the market timing system I developed years ago based on the Weekly Initial Unemployment Insurance Claims. You can see in the chart below that the Weekly Initial Unemployment Insurance Claims are now placing my chart in the strongest bullish area.
Here are the guidelines again:
Weekly Numbers Above 350,000 and Climbing
I focus more on selling in the money covered calls and doing Spy Put Options aggressively. As the weekly claims rise and get closer to 400,000 I normally buy puts on stocks that based on chart patterns I believe are overvalued and will pull back if the market direction corrects. I tend to place fewer trades and begin to raise cash. Above 400,000 I raise a lot more cash.
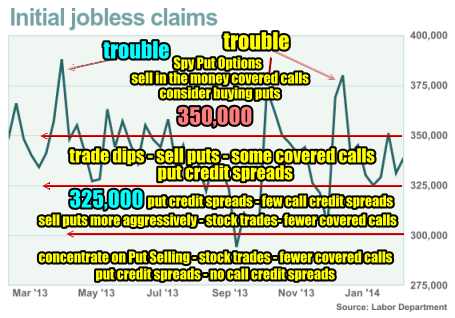
Weekly Numbers Between 325,000 to 350,000
When the weekly numbers move below 350,000 but stay above 325,000, I focus on trading dips in stocks through selling puts usually naked, doing some credit put spreads and doing some covered calls. This is because in this range normally the market can still move higher but it is more difficult for it to be a straight line up. This means I can sell some covered calls when the market is pushing higher because the likelihood of it not pushing too high is greater. This will leave my covered calls normally out of the money and expired. I also pick up some stocks for short-trades often referred to as swing trades or even day trades. I don’t do either but instead rely on my Bollinger Bands strategy for timing entry and exit points. This is a good place for put credit spreads as well since it offers more protection than selling puts naked. This is also not too bad an area for credit call spreads as stocks may have a more difficult time rising too quickly or high enough to place credit call spreads at risk. I tend though not to do a lot of credit call spreads. I prefer being on the Put Selling side.
Weekly Numbers Between 300,000 to 325,000
When the numbers fall below 325,000 stocks have a much easier time moving higher. This means being careful with covered calls unless I do not care if the stock is exercised away. It also means being careful on credit call spreads and naked calls. I sell puts far more aggressively here and will definitely consider credit put spreads as well. Iron condors and often butterflies seem to perform well at this level.
Weekly Numbers Below 300,000
This is where the numbers are again this week. Below 300,000 the market direction rarely corrects severely lower. This means I concentrate heavily on Put Selling, doing stock trades particularly using the Bollinger Bands Strategy Trade.
I do limited covered calls unless I want to be exercised out. Buy-writes work very well here. In general though at this level I prefer Put Selling which I consider superior to covered calls in my opinion. You can read this article to understand why.
At the level below 300,000 I increase the quantities of naked puts I sell and as the numbers fall to 250,000 or more I bring more cash into play. I do no credit call spreads but the number of naked puts is easily 4 or more times higher. When the Weekly Initial Unemployment Insurance Claims get to this level the economy is usually picking up the pace and stocks are doing well or certainly holding their own. I usually look for earnings to increase.
This Year Could Be Different
This year however could be a bit different as much of the rise in the employment numbers can be attributed to a very accommodative Federal Reserve policy of zero interest rates. When rates rise, almost always there will be some give back on stock valuations. Therefore I remain cautious with my trades this year as the markets continuing to trade near their all-time highs.
Market Timing System Internal Links
Profiting From Understanding Market Direction (Articles Index)
Understanding Short-Term Signals
Market Direction Portfolio Trades (Members)