
Regular readers of my website know there are a multitude of market timing systems which investors have sworn by or in many cases sworn at. One of the better market timing systems I have seen is the Weekly Initial Unemployment Insurance Claims. This article discusses how the Weekly Initial Unemployment Insurance Claims work as a market timing system. I have used this system for years and find it to be one of the more reliable systems. As of today, that market timing system is advising to continue to stay invested.
The number of Americans filing new claims for unemployment rose less than expected last week continuing to point to strength in the labor market. Initial claims increased 11,000 to a seasonally adjusted 278,000 for the week ended January 31 according to the Labor Department. The prior week (Jan 24) was increased slightly by 2000 claims.
The number of people receiving benefits moved up by about 6000 to 2.40 million by the end of Jan 24.
Four Week Moving Average
The four-week moving average of claims which tends to remove a lot of the weekly volatility and tries to give a clearer picture of the general underlying trend shows a decline of 6500 claims falling to an average of 292,750.
Unemployment For January 2015
On Friday investors get the often dreaded nonfarm payroll or unemployment report for the prior month. For January 2015, estimates are for employment to have increased by 234,000 to 252,000 jobs. Any number less than 220,000 could see stocks “shudder” a bit at the open on Friday but shouldn’t alter the course of stocks in the short-term. Any surprise such as below 200,000 could send stocks lower.
Latest Weekly Initial Unemployment Insurance Claims
The number of new claims dipped last week further than expected to 312,000 which was below the consensus for 314,000. As well the four-week average which tends to smooth out the weekly spikes and dips came in at 311,750 which was a drop of 3750. Still though unemployment has a long way to go to reach the numbers from before the credit crisis. Let’s take a look at some historic numbers.
Market Timing System Says Stay Invested
I have for years used the Weekly Initial Unemployment Insurance Claims to advise when to apply more capital, when to pull back and when to raise more cash than usual and move to the downside for trading. Years ago I developed the chart you see below as a market timing system guideline.
Here are the guidelines again:
Weekly Numbers Above 350,000 and Climbing
I focus more on selling in the money covered calls and doing Spy Put Options aggressively. As the weekly claims rise and get closer to 400,000 I normally buy puts on stocks that based on chart patterns I believe are overvalued and will pull back if the market direction corrects. I tend to place fewer trades and begin to raise cash. Above 400,000 I raise a lot more cash.
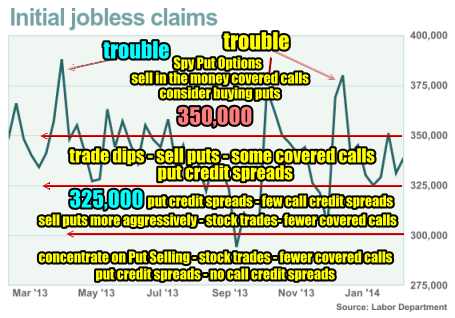
Weekly Numbers Between 325,000 to 350,000
When the weekly numbers move below 350,000 but stay above 325,000, I focus on trading dips in stocks through selling puts usually naked, doing some credit sput preads and doing some covered calls. This is because in this range normally the market can still move higher but it is more difficult for it to be a straight line up. This means I can sell some covered calls when the market is pushing higher because the likelihood of it not pushing too high is greater. This will leave my covered calls normally out of the money and expired. I also pick up some stocks for short-trades often referred to as swing trades or even day trades. This is a good place for put credit spreads as well since it offers more protection than selling puts naked. This is also not too bad an area for credit call spreads as stocks may have a more difficult time rising too quickly or high enough to place credit call spreads at risk. I tend though not to do a lot of credit call spreads. I prefer being on the Put Selling side.
Weekly Numbers Between 300,000 to 325,000
When the numbers fall below 325,000 stocks have a much easier time moving higher. This means being careful with covered calls unless I do not care if the stock is exercised away. It also means being careful on credit call spreads and naked calls. I sell puts far more aggressively here and will definitely consider credit put spreads as well. Iron condors and often butterflies seem to perform well at this level.
Weekly Numbers Below 300,000
Below 300,000 the market direction rarely corrects severely lower. This means I concentrate heavily on Put Selling, doing stock trades particularly using the Bollinger Bands Strategy Trade.
I do limited covered calls unless I want to be exercised out. Buy-writes work very well here. In general though at this level I prefer Put Selling which I consider superior to covered calls in my opinion. You can read this article to understand why.
At the level below 300,000 I increase the quantities of naked puts I sell and as the numbers fall to 250,000 or more I bring more cash into play. I do no credit call spreads but the number of naked puts is easily 4 or more times higher. When the Weekly Initial Unemployment Insurance Claims get to this level the economy is usually booming and stocks are doing well or certainly holding their own.
Market Timing System Summary
The trend in unemployment continues to point to the likelihood that the economy is improving and the Fed will tighten shortly. The Weekly Initial Unemployment Insurance Claims have been a mainstay of my Market Timing System for two decades. Today’s report continues to indicate that the weakness being experienced and the high volatility should not result in a market collapse. Of course, nothing is written in stone and markets can always surprise to the downside.
With stocks thrashing and whipsawing their way since the start of the year, investors might question the Weekly Initial Unemployment Insurance Claims Market Timing System. In my case I believe, staying cautious through high volatility periods in stocks, is always a wise decision.
Market Timing System Internal Links
Profiting From Understanding Market Direction (Articles Index)
Understanding Short-Term Signals
Market Direction Portfolio Trades (Members)