
Market Direction yesterday was all about the financials, energy, coal and defense. Today the selling hit all those sectors as investors decided they didn’t want those stocks without Romney as President. But that is just part of it. Overall all stock markets have been in major declines and the NASDAQ which lead the rally since March 2009 is now leading the stock markets into a serious correction.
The NASDAQ Market Direction
The NASDAQ market direction is in solid bearish territory and today closed below the 200 day moving average. The NASDAQ market direction has been unable to reclaim the 50 day moving average. Once the NASDAQ fell through the 50 day moving average it then plunged on good volume through the 100 day moving average. It has been unable to regain the 100 day moving average and is now pushing below the 200 day moving average. The NASDAQ index is down 8% from its most recent high and has set up a pattern of lower highs and lower lows in market direction. The market direction chart below shows this pattern and the action on the long-term moving averages. The bear is stirring for the NASDAQ index. In my opinion based on the technical fundamentals and charts the chance of the NASDAQ index recovering is slim. It took about 5 weeks for the NASDAQ to lose 8%. I believe it will move at least another 7% lower over the coming weeks as it enters a stronger market direction correction.
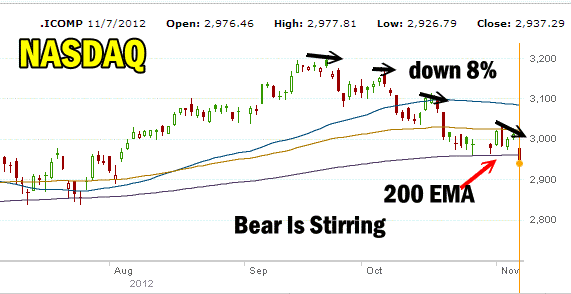
NASDAQ Index as of Nov 7 2012
The Dow Market Direction
The Dow market direction today broke through its 200 day moving average. The similarities among all three indexes is obvious. The Dow is showing market direction lower highs and lower lows. The 50 day was tested only twice and broke on the second test. The Dow fell through the 100 day and after four unsuccessful attempts it managed to push above the 100 day but could not break through the 50 day which is now resistance. Today it crashed through the 100 day and closed below the 200 day moving average. The bear is stirring for the Dow Index as well and to believe it can recover and move higher I think is wishful thinking. Market direction could rally, but it has to break through the 50 day moving average which at present is not going to be easy. The easier market direction move is lower and that is what the Dow will do over the coming weeks.
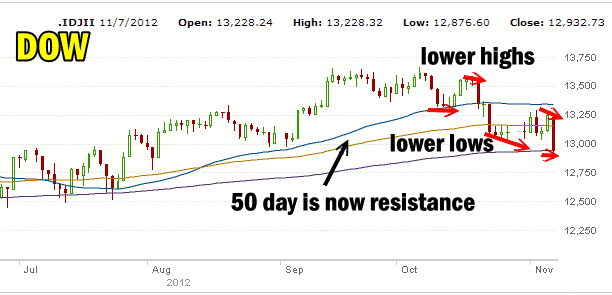
Dow Jones Market Direction as of Nov 7 2012
S&P 500 Market Direction
The S&P 500 is the only index that has not fallen below the 200 day moving average. Today’s big market direction decline pushed it deep below the 100 day and has done a lot of technical damage to the market. From the start of June the S&P market direction was higher as it continued to show a repeat pattern of higher highs and higher lows. But that pattern is now finished and the S&P market direction has become a pattern of lower highs and lower lows. The 50 day moving average broke and is now resistance. Each time the S&P market direction has tried to recover to the 50 day moving average it has failed. Today it broke the 100 day and is sliding towards the 200 day moving average. I believe market direction will follow the other indexes lower in the coming weeks.
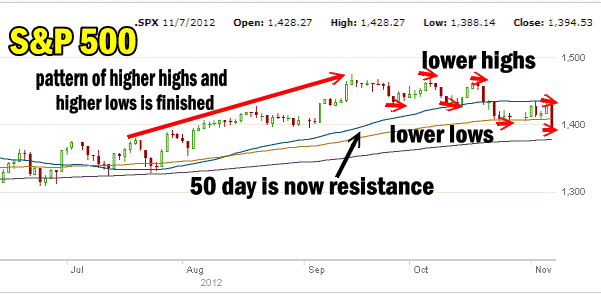
Market Direction is down on the S&P 500
MACD Sell Signal Generated
On all the Indexes, MACD (Moving Average Convergence / Divergence) issued a market direction sell signal between September 25 to 26 and it has stayed consistently negative. Not once since then has MACD gone positive. It continues to point to a lower markets in all three indexes. While the S&P has held up the best it also did not rise as far as the other two indexes which could just mean that it did not get ahead of itself as the other two indexes did.
Market Timing Indicators for Nov 7 2012
Below are the market timing indicators for today, Nov 7 2012. After such heavy selling they are of course, lower.
Momentum failed to turn positive yesterday and today is has pulled back dramatically.
MACD which has been negative since September 25 when it gave a sell signal still indicates lower valuations are ahead.
The Ultimate Oscillator which yesterday was finally positive is back negative and falling.
Rate of Change is now back negative and looks to be signaling that lower prices are ahead.
The Slow Stochastic is indicating lower prices will be seen in this week and into next.
The Fast Stochastic though is indicating that stocks are oversold but with a K period reading of only 8.42 and a D period reading of 24.49, the Fast Stochastic is signaling market direction is lower despite being oversold.
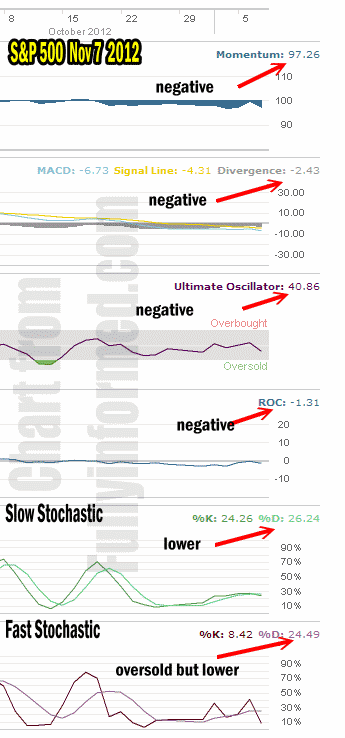
Market Timing indicators show market direction is lower
Market Direction Outlook – Raise Cash Buy Protection
The market direction outlook following today’s heavy selling is to raise some cash and put on some protection to profit from the coming correction. Only one indicator is signaling a possible bounce, namely the Fast Stochastic. However even the Fast Stochastic is still signaling market direction is lower, confirming all the other indicators.
In the FullyInformed Members section I have put up an article on what my next steps will be as I have created the category of “Corrections and Bears”. In my opinion we are going to see more of this correction in coming weeks. The purpose of the Corrections and Bears category in the Members section is to discuss strategies to profit from the correction as well as protect longer-term positions, both options and stock. To read the article on raising cash and preparing for a more severe correction, members can login to the article and non-members can join here.
Today’s market direction outlook replaces all previous outlooks. Yesterday I discussed possible lows in the S&P as being between 1375 to 1400. I believe that is now changes as Market Direction is clearly signaling a more sustained and deeper correction lies ahead. Any bounce is suspect and I will be buying SPY PUTS in any bounce. The bear is stirring in his cave.