
The market direction outlook for Friday was for stocks to move higher. All three indexes and IWM (Russell 2000) ended higher with the Dow, S&P and IWM setting new intraday highs once again. The NASDAQ meanwhile is within a few points of its 52 week high and still within an easy move of passing 4000. The uptrend remains intact and stocks are continuing to rally higher with the overall indexes. Part of the reason for this is the lack of “bad news”. There has been no real bad news to speak of, just a moment here or there. The lack of a string of bad news means there is little to weigh on investors’ minds.
Seventh Straight Week Gains
The Down gained 0.7 percent this week which marked the 7th week of gains which is not the longest streak since January 2011.
Jobless Applications Are Back To Pre-Recession Levels
Another factor in the continuing strength of the rally is the Weekly Initial Unemployment Insurance Claims from Friday which showed that insurance applications are almost back to pre-recession levels.
Dow Up 22 Percent
With the Dow now up 22 percent, it is on track for its best year since 2003.
Gold Plunge Continues
The drop in the price of gold over the past several weeks down to the $1244 (present) level, is somewhat expected as long as the economy continues to show signs of mending and expansion. The news that a deal has been struck with Iran over their nuclear program is just another reason for gold to fall lower. If we look at the gold price over the last 10 years we can see the crisis of 2008 actually saw gold pull back but then as the belief that the financial credit crisis was just the “tip of the iceberg” set in, gold bugs pushed up the price of gold. This continued as the Federal reserve flooded markets with currency through various Quantitative Easing programs. Then the European issues came to the forefront and the price of gold made another rally to a second high. Even today with the Federal Reserve continuing with its Quantitative Easing program, the price of gold has managed to hang on and not return to 2008 levels. While many analysts believe gold will fall back to $700 if the economy does continue to improve, there is no one who can predict with any accuracy what gold will do. One thing is certain, the lack of a further collapse of the world’s economies has not been gold for the price of gold. Personally I think gold and gold stocks are meant to be traded according to the direction of the commodity. It is painfully apparent that at present gold is in a bear market. Therefore until that changes my personal preference is to trade stocks like ABX Stock with a careful eye on the downside. I wrote about Barrick Gold Stock earlier this evening which you can read here.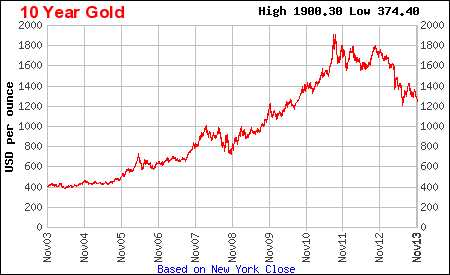
Market Direction S&P 500 Intraday For Nov 22 2013
The 1 minute market direction chart for the S&P 500 below shows how the day progressed. In the morning there was very little selling at the open and the market direction immediately began to climb. It was fairly steady as it became obvious the market direction was going to push past 1800. It did so by late morning and held above 1800 until the mid-afternoon when a little selling tested the 1800 level. Once the test was done investors seemed satisfied it would hold and pushed higher. The S&P 500 closed near the highs of the day.
Advance Declines For Nov 22 2013
Advancing issues outpaced declining issues again on Friday with 59% of all stocks advancing and 37% declining. New highs picked up the pace with 246 new highs versus 114 new lows. The increase in new highs bodes well for the start of the new week.
Market Direction Closing For Nov 22 2013
The S&P 500 closed at 1,804.76 up 8.91 to a new all-time closing high. The Dow closed at 16,064.77 up 54.78 and another new all-time closing high as well. The NASDAQ closed at 3,991.65 up 22.49 and finally ready to break 4,000.
The IWM ETF closed at $111.85 after making a new intraday high at 111.97.
Market Direction Technical Indicators At The Close of Nov 22 2013
Let’s review the market direction technical indicators at the close of Nov 22 2013 on the S&P 500 and view the market direction outlook for Nov 25 2013.
The most important support line in the S&P 500 at this time in the ongoing rally remains 1750. That support line is holding the market direction up at present. A number of analysts are discussing the 1775 as the new support level but I do not see any support yet at that level.
For Momentum I am using the 10 period. Momentum is still positive but the move higher today actually saw momentum pull back.
For MACD Histogram I am using the Fast Points set at 13, Slow Points at 26 and Smoothing at 9. MACD (Moving Averages Convergence / Divergence) issued a sell signal on Nov 7 which was not confirmed. The signal of Nov 14 was market up and it was confirmed on Nov 15. Yesterday another sell signal was issued which was not confirmed today. Today MACD finally turned back slightly positive with a reading of 0.21. Still though the signal is back up which is a bonus for the bulls.
The Ultimate Oscillator settings are Period 1 is 5, Period 2 is 10, Period 3 is 15, Factor 1 is 4, Factor 2 is 2 and Factor 3 is 1. These are not the default settings but are the settings I use with the S&P 500 chart set for 1 to 3 months.
The Ultimate Oscillator is back climbing into positive territory.
Rate Of Change is set for a 21 period. The Rate Of Change is positive and moved up slightly againtoday for the second day.
For the Slow Stochastic I use the K period of 14 and D period of 3. The Slow Stochastic is signaling that the market direction is up and it is overbought.
For the Fast Stochastic I use the K period of 20 and D period of 5. These are not default settings but settings I set for the 1 to 3 month S&P 500 chart when it is set for daily. The Fast Stochastic is signaling that the market direction is up and it is extremely overbought.
Market Direction Outlook And Strategy for Nov 25 2013
The market direction technical indicators are all in agreement that the market direction is up for Monday. The Fast Stochastic is extremely overbought but the signal up is very strong from the Fast Stochastic. Overall then the market direction is higher.
The movement higher continues to draw in more and more investors. This is only natural and there are no signals that the market direction will collapse here. So while it may seem odd that the market direction remains higher, despite so many investors continuing to flock to stocks, there is a lot of precedence for this kind of action. The thing to remember is that often investors became complacent as the market direction pushed higher and that is something I do not do.
As the market direction moves higher, I still look for those stocks that I can sell puts against, but often the strategy must be changed now to protect my capital from the possibility that the market direction will change over the next month or into mid-January.
My crystal ball will not see that far into the future but it is rare when the market does not have at least an 8 or 10 percent correction in a year and this year we have not seen that. By adjusting strategies to add in a higher degree of safety I can continue to sell puts and trade in my favorite stocks fully aware that a correction will eventually come.
For now though there is nothing on the horizon that indicates a correction could be imminent. As a result I continue to place more capital at risk. For Monday the market direction appears to be up and we should see more green at the close.
One thing to remember is that big round numbers are difficult for the indexes to cross easily. With the NASDAQ still trying to push beyond 4000, the S&P at 1800 and the Dow across 16,000, don’t be surprised if the market tries to retest these levels more than once in the coming days or weeks ahead.
Market Direction Internal Links
Profiting From Understanding Market Direction (Articles Index)
Understanding Short-Term Signals
Market Direction Portfolio Trades (Members)
Market Direction External Links
Market Direction IWM ETF Russell 2000 Fund Info
Market Direction SPY ETF 500 Fund Info