
The outlook for Thursday was for the Fed induced rally to continue. I felt there could be some weakness to start the day off but that the direction would be up. From the Federal Reserve minutes and comments from Chair Yellen, the only two words that mattered to investors has been “Considerable Time” when speaking about interest rates. Before Yellen’s comments many analysts were expecting rates to move higher by June 2015. Now many are discussing the possibility of it being July or even into the early fall of 2015.
If as well, the EU stays on the verge of recession in many of its members, that will also help slow a rise in US rates as well.
Weekly Initial Unemployment Insurance Claims
The Weekly Initial Unemployment Insurance Claims came in at 280,000 which was below economists’ forecasts. The drop in claims continues to point to employers who are not laying off workers. It also shows that the unemployment trend continues to improve which indicates the economy is also improving. Those readers who know how I use the Weekly Initial Unemployment Insurance Claims for trading purposes, know that this is a signal to stay invested.
For investors unaware of this system you can read how this market timing system works through this link. You can also review all the market timing articles through this index and finally, you can review all the weekly unemployment market timing system through this category.
Let’s look at today’s intraday action to start.
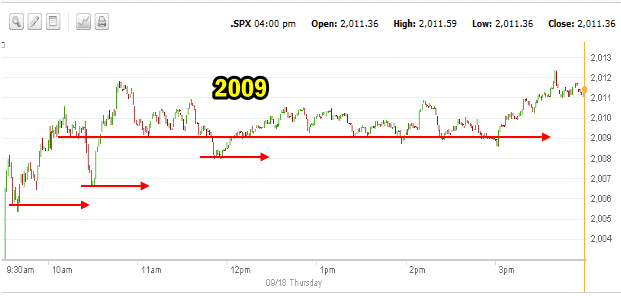
SPX Intraday One Minute Chart
The one minute chart below shows today’s action. The market in the morning set up a pattern of lower highs. By 10:00 AM the SPX was back at the 2009 level. An early morning rally to almost 2012 failed but the market did not sell lower but instead clung to the 2009 level. The afternoon saw the SPX trend sideways holding the 2009 level right into the final hour when buyers stepped in a bit deeper into stocks and pushed the SPX into a new all-time high of 2,012.34 before closing at 2011.36. All in all it was a strong finish and a very good day for the SPX.
Intraday Market Direction for Sep 18 2014
Advance Declines For Sept 18 2014
Volume was steady today at 3.2 billion shares traded. Despite the move higher in the index, only 54% of the volume was to the upside. Meanwhile 118 new highs were recorded but also, 87 new lows, one of the higher new low counts in quite some time.
While I still see nothing of concern, it always is worth keeping an eye to be certain that today’s new lows numbers do not build but fall back from here.
Market Direction Closings For Sept 18 2014
The S&P closed at 2011.36 up 9.79. The Dow closed at 17,265.99 up 109.14 for another new all-time closing high and new intraday all-time high. The NASDAQ closed at 4593.43 up 31.24.
The Russell 2000 IWM ETF rose70 cents or 0.61% to close at $115.43.
Market Direction Technical Indicators At The Close of Sept 18 2014
Let’s review the market direction technical indicators at the close of Sept 18 2014 on the S&P 500 and view the market direction outlook for Sept 19 2014.
Market Direction Technical Analysis for Sep 18 2014
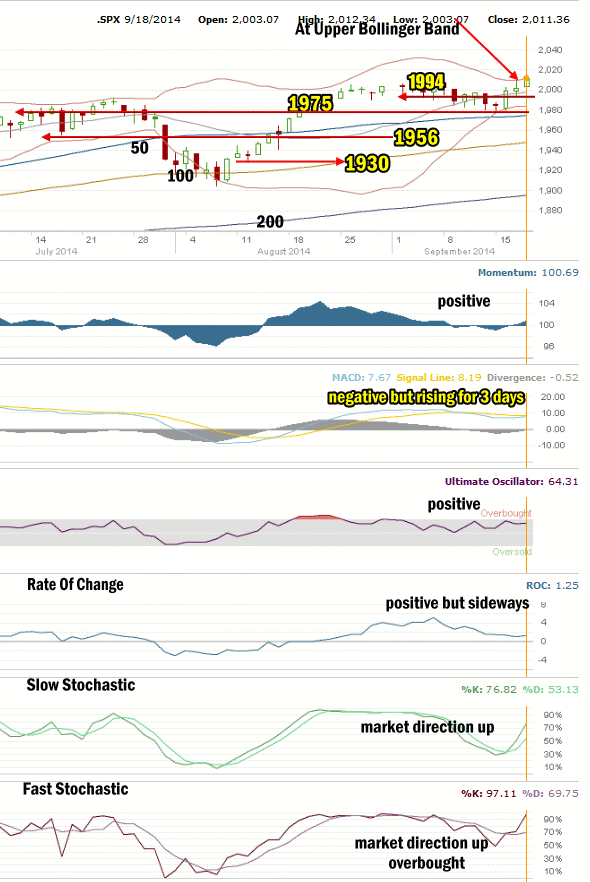
Stock Chart Comments: Today’s move higher continues the rally from the Fed’s comments and minutes released yesterday. This rally places the SPX into the Bollinger Bands Squeeze to the upside and as explained in yesterday’s comments, it has set up the SPX for a breakout to new highs.
1994 and 1990 Level: These two are now very light support.
1975, 1956 Support: Both are light support and both may be tested in coming days. 1975 is the more significant valuation at this point.
1930 Support: Light support is found at 1930.
Strong Support Levels are at 1870 and 1840 (no longer shown). At present I am not expecting any break of either of these levels.
The other two support levels not shown in the chart above are 1775 and 1750. I have explained that these two are critical support for the present bull market. While 1775 is important it is 1750 that is now the bottom line.
A break of 1750 would mark a severe correction of more than 13% from the most recent high. This would be the biggest correction since April 2012. A pull-back of that size would definitely stun investors at this point and it is not something I am anticipating as there are no signs of any impending correction of that magnitude.
Momentum: For Momentum I am using the 10 period. Momentum has been the best indicator, replacing MACD as the most accurate indicator. Momentum is now positive.
MACD Histogram: For MACD Histogram, I am using the Fast Points set at 13, Slow Points at 26 and Smoothing at 9. MACD (Moving Averages Convergence / Divergence) issued a confirmed sell signal on Sept 10. MACD continued to stay negative on Thursday but is continuing to rise for the third day.
Ultimate Oscillator: The Ultimate Oscillator settings are: Period 1 is 5, Period 2 is 10, Period 3 is 15, Factor 1 is 4, Factor 2 is 2 and Factor 3 is 1. These are not the default settings but are the settings I use with the S&P 500 chart set for 1 to 3 months. The Ultimate Oscillator is positive and trending higher.
Rate of Change: Rate Of Change is set for a 21 period. The rate of change is still positive and trending sideways which indicates no new capital is flowing into stocks.
Slow Stochastic: For the Slow Stochastic I use the K period of 14 and D period of 3. As the Slow Stochastic tries to predict the market direction further out than just one day. The Slow Stochastic is signaling that the market direction is up.
Fast Stochastic: For the Fast Stochastic I use the K period of 20 and D period of 5. These are not default settings but settings I set for the 1 to 3 month S&P 500 chart when it is set for daily. The Fast Stochastic is also signaling that the market direction is up and it is overbought.
Market Direction Outlook And Strategy for Sept 19 2014
After two days of rallying on the back of Fed comments and minutes, stocks may trend more sideways on Friday as investors digest news out of Europe with the Scottish independence vote which should be completed by the time the markets open. I am not expected Scotland to vote for independence and as such I think there is a good chance for a short-term pop in the morning for stocks and then a sideways pattern into the close ahead of the weekend.
Today’s action ends the recent bout of weakness and prepares investors for higher valuations in coming weeks. While there will probably be weakness at times in the remainder of the month, the move is definitely higher for stocks at this time.
The Bollinger Bands Squeeze is supporting a breakout of stocks to the upside.
The Fed two day rally should erode on Friday but that does not mean stocks will pullback by much. For Friday’s market direction, stocks may pop in the morning and then turn sideways but even if they close slightly negative, the trend at present is higher for stocks.
Stay FullyInformed With Email Updates
Market Direction Internal Links
Profiting From Understanding Market Direction (Articles Index)
Understanding Short-Term Signals
Market Direction Portfolio Trades (Members)