
The market direction outlook for Friday Nov 7 2014 was for stocks to be mixed with some weakness in the morning and then sideways for much of the day with either a small gain or small loss. By the end of the day the S&P had followed this outlook fairly consistently. The day ended with a slight gain of 0.71.
Unemployment Rate Falls To 5.8%
The big news on Friday was October’s unemployment rate which fell to 5.8%, marking the lowest level since 2008. Payrolls were up by 214,000 for October while September’s monthly gains were increased to 256,00 from 248,000. The two key aspects of the report worth noting were the participation rate which rose just slightly from 62.7% to 62.8% and the wage growth which was up just 0.1% for the month. Wages are on track for a gain of just 2% this year which is not very inflationary. Neither the participation rate or the wage gains indicate any growth in inflation pressures for October. One thing to mention is that this is the 49th consecutive month of job gains which is not the longest streak since the 1930’s. With October’s report it is also the longest streak of 200,000 plus monthly job gains since a 19 month period from 1993 to 1995.
SPX Market Direction 5 Day 5 Minute to Nov 7 2014
The five-day chart below shows why I am continuing to sell puts and stay invested. The high on Monday was quickly lost by Tuesday morning but the market then set up a pattern of higher lows. By Thursday the S&P had broken through Monday’s high and on Friday despite selling in the morning and late afternoon, the S&P stay above the morning high. A new all-time intraday high was also made on Friday. Until we see the pattern of higher lows broken, the market direction is still up.
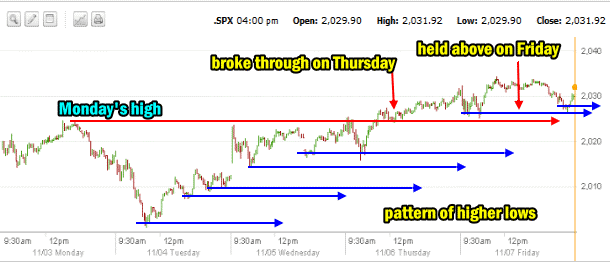
SPX 5 day 5 minute outlook to Nov 7 2014
Advance Declines For Nov 7 2014
Volume has improved remarkably since late summer. On Friday 3.7 billion shares were traded. Of that volume 64% was up and 59% of all stocks were rising. Still though new highs fell back to 147 but new lows also tumbled to 40 from 60 on Thursday. Volume is still bullish for stocks..
Market Direction Closings For Nov 7 2014
The S&P closed at 2031.92 up 0.71. The Dow closed at 17,573.93 up 19.46. The NASDAQ closed at 4632.53 down 5.94.
The Russell 2000 IWM ETF closed up 18 cents at $116.71 for a gain of 0.15%.
Market Direction Technical Indicators At The Close of Nov 7 2014
Let’s review the market direction technical indicators at the close of Nov 7 2014 on the S&P 500 and view the market direction outlook for Nov 10 2014.
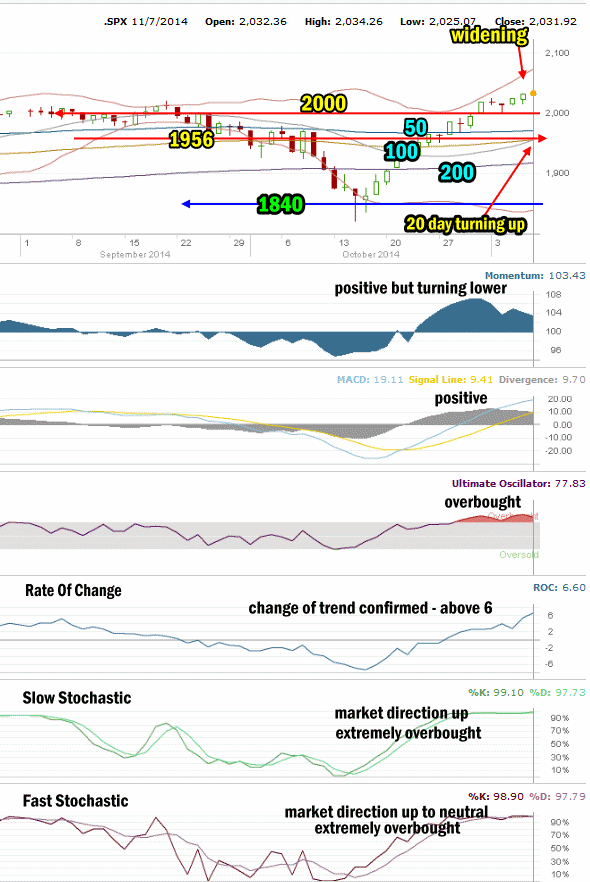
Market Direction Technical Analysis for Nov 7 2014
Stock Chart Comments: Friday stocks were pretty well sideways with the close almost unchanged from Thursday. However the Upper Bollinger Band continues to widen and the 20 day simple moving average (SMA) is almost ready to cross up and over the 100 day exponential moving average (EMA) which will signal stocks have further to rise. The first level of support at present is still 2000.
Strong Support Levels are at 1870 and 1840. Both levels are strong enough to delay the market falling. 1956 and 1970 are back as support for stocks. 2000 is the highest level of support at present and while not strong, it should have enough strength to hold sellers back for at least a day in the event of an interim pullback. I am not expecting this to happen at this stage of the rally. The market direction still looks like it wants to consolidate and then possibly move higher.
The other two support levels not shown in the chart above are 1775 and 1750. I have explained that these two are critical support for the present bull market. While 1775 is important it is 1750 that is now the bottom line.
A break of 1750 would mark a severe correction of more than 13% from the most recent high. This would be the biggest correction since April 2012. A pull-back of that size would definitely stun investors at this point and it is not something I am anticipating at this time.
Momentum: For Momentum I am using the 10 period. Momentum is still positive but pulled back again on Friday.
MACD Histogram: For MACD Histogram, I am using the Fast Points set at 13, Slow Points at 26 and Smoothing at 9. MACD (Moving Averages Convergence / Divergence) issued a buy signal on October 22. MACD is continuing to gain strength.
Ultimate Oscillator: The Ultimate Oscillator settings are: Period 1 is 5, Period 2 is 10, Period 3 is 15, Factor 1 is 4, Factor 2 is 2 and Factor 3 is 1. These are not the default settings but are the settings I use with the S&P 500 chart set for 1 to 3 months. The Ultimate Oscillator is positive and remains extremely overbought..
Rate of Change: Rate Of Change is set for a 21 period. The rate of change is staying positive and confirming the trend change to up and on Friday it broke through to a reading of 6.60 which indicates strength to the upside but also if it continues to rise much more will begin to indicate a shift back to down for stocks. This bears watching.
Slow Stochastic: For the Slow Stochastic I use the K period of 14 and D period of 3. As the Slow Stochastic tries to predict the market direction further out than just one day. The Slow Stochastic is signaling market direction is up and it is extremely overbought.
Fast Stochastic: For the Fast Stochastic I use the K period of 20 and D period of 5. These are not default settings but settings I set for the 1 to 3 month S&P 500 chart when it is set for daily. The Fast Stochastic is signaling up to neutral for stocks and is extremely overbought.
Market Direction Outlook And Strategy for Nov 10 2014
The outlook for Monday and the rest of this article is for USA Members. The outlook for Monday also contains 2 trade ideas along with some tips for what to be watching as the week starts.
FullyInformed USA Members can login directly through this link to review the latest market direction outlook and investing strategy notes for Nov 10 2014 or Members can sign in to the full USA members site here. Non-members can join here or read about the benefits of being a member.
Stay FullyInformed With Email Updates
Market Direction Internal Links
Profiting From Understanding Market Direction (Articles Index)
Understanding Short-Term Signals
Market Direction Portfolio Trades (Members)