
Thursday’s weakness ahead of Friday’s jobs numbers is understandable. Investors are nervous especially after today’s Weekly Initial Unemployment Insurance Claims continue to point to solid job growth. This is one of the areas the Fed is watching to determine whether to start raising interest rates in December. You can tell from Fed Chair Yellen’s comments this week that she has a preference for starting to raise rates.
Today was primarily sideways although the S&P did break the 2100 level several times today. You can see in the chart just how flat the market was. The close was lower by just 2.38.
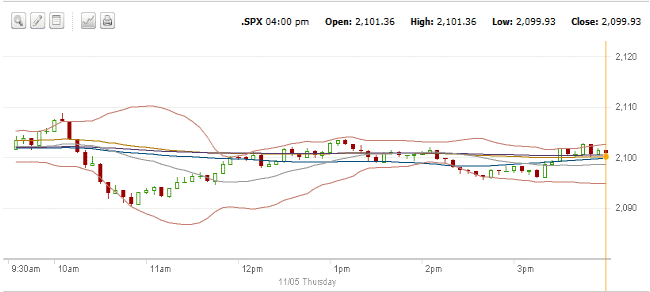
SPX 5 minute intraday for Nov 5 2015
Market Direction Closings
At the end of the day the indexes closed with very slight losses. The S&P closed at 2,099.93 down 2.38. The DOW closed at 17,863.43 down 4.15. The NASDAQ closed at 5,127.74 down 14.74.
Advance Decline Numbers
Volume on Thursday was 4 billion shares which is fairly high for the day before nonfarm payroll numbers are released. Usually volume is lower the day before the monthly unemployment report.
Volume was balanced with 54% of trades moving lower and 44% of all volume higher. 47% of all issues on New York were advancing and 50% were declining. 3% were unchanged. There were 68 new highs and 60 new lows, again a balanced market.
The NASDAQ had 90 new highs and 72 new lows. Volume was 2 billion shares with 62% of all volume moving lower.
Market Direction Technical Indicators At The Close of Nov 5 2015
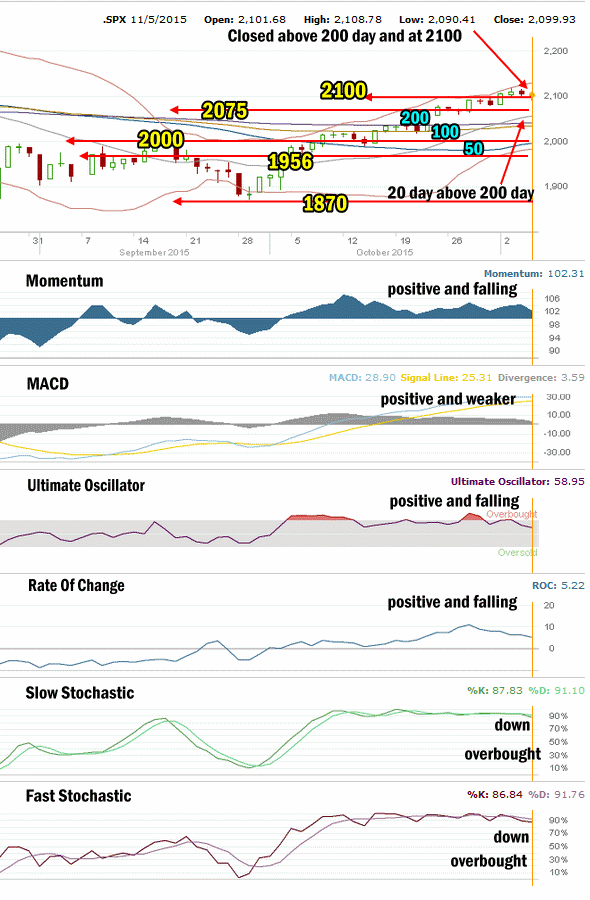
SPX Market Direction Technical Analysis for Nov 5 2015
Stock Chart Comments:
The S&P closed at 2100 and above the 200 day moving average. The 20 day simple moving average (SMA) is continuing to rise above the 200 day moving average. The 100 day is starting to move higher and could cross the 200 day shortly. This would be another up signal. The 50 day moving average is also turning higher.
Support and Resistance Levels:
These are the present support and resistance levels.
2100 is light support. Stocks have been unable to stay above this level and push higher on numerous occasions. It remains resistance.
2075 is light support. Below that is 2050 which is light support. Stronger support is at 2000 which had repeatedly held the market up throughout each pullback in January and February but failed under the waves of selling in the last correction. Stocks continue to have trouble holding the 2000 level.
Weak support is at 1970 while stronger support is at 1956 and technically it is more important than 1970 for the market. 1940 is light support. 1920 is now light support. 1900 is more symbolic than anything else.
1870 and 1840 are both levels with strong enough support to delay the market falling and should see a sideways action attempt while investors decide whether to sell or buy. So far 1870 has held the market up better than any of the other support levels aside from 2000 which held the market up for months before the collapse in August.
The other two support levels are 1775 and 1750. I have explained that these two are critical support for the present bull market. While 1775 is important it is 1750 that is the bottom line.
A break of 1750 would mark a severe correction of 384.72 points or 18% from the all-time high of 2134.72. This would be the biggest correction since April 2012. A pull-back of that size would definitely stun investors and bring to question whether the bull market is finished.
Momentum: For momentum I use a 10 period when studying market direction. Momentum is positive and falling.
MACD Histogram: For MACD Histogram, I am using the Fast Points set at 13, Slow Points at 26 and Smoothing at 9. MACD (Moving Averages Convergence / Divergence) issued a buy signal on Friday Oct 2. That signal continues to lose strength.
Ultimate Oscillator: The Ultimate Oscillator settings are: Period 1 is 5, Period 2 is 10, Period 3 is 15, Factor 1 is 4, Factor 2 is 2 and Factor 3 is 1. These are not the default settings but are the settings I use with the S&P 500 chart set for 1 to 3 months. The Ultimate Oscillator is positive and falling for a second day.
Rate of Change: Rate Of Change is set for a 21 period. The rate of change signal is positive and is falling again today. At a reading of 5.22 it is still quite bullish for stocks.
Slow Stochastic: For the Slow Stochastic I use the K period of 14 and D period of 3. The Slow Stochastic tries to predict the market direction further out than just one day. The Slow Stochastic is overbought and signaling down.
Fast Stochastic: For the Fast Stochastic I use the K period of 20 and D period of 5. These are not default settings but settings I set for the 1 to 3 month S&P 500 chart when it is set for daily. The Fast Stochastic is pointing down for stocks and is also overbought.
Market Direction Outlook for Nov 6 2015
The technical indicators are split. Two are signaling down while the remaining 4 indicators are moving lower. In the end though, tomorrow will be about the jobs numbers. If employment rises it will add pressure to the Fed to raise rates in December. If there are fewer new jobs, it will probably hold the Fed back at least another month before raising rates.
Overall tomorrow is about the Fed and Jobs Numbers. The employment number is usually released around 8:30. That should give investors enough time to position themselves to profit from the market movement as Friday investors play the numbers game..
Stay FullyInformed With Email Updates
Market Direction Internal Links
Profiting From Understanding Market Direction (Articles Index)
Understanding Short-Term Signals
Market Direction Portfolio Trades (Members)
Market Direction External Links
IWM ETF Russell 2000 Fund Info
Market Direction SPY ETF 500 Fund Info