
The market direction outlook for Friday was for stocks to continue to advance but for the advance to slow as the market deals with a very overbought condition. My outlook was not bullish enough as investors jumped in on Friday and pushed stocks to new record highs. Meanwhile the US dollar continued its advance pushing to new 7 year highs against the Yen and pressuring currencies around the globe. Gold and commodities in general pulled back as the dollar advanced further.
SPX Market Direction Intraday for Oct 31 2014
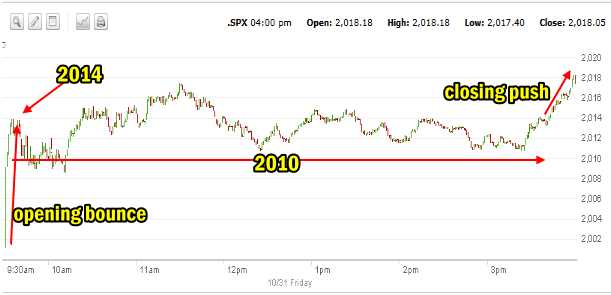
You can see in the one minute intraday chart for the SPX below, that stocks on Friday jumped at the open and broke through to 2014. Into the morning stocks stayed up above 2010 and by 11:30 the S&P had set a new record. This brought in some light selling but still the SPX stayed above 2010. By the close the last half hour saw some additional heavy buying which pushed the close to a new record.
SPX Intraday Oct 31 2014
Advance Declines For Oct 31 2014
Volume was heavier on Friday reaching 4.3 billion shares which marked another strong day of trading. 79% of all volume traded was up and 322 new highs were recorded. Only 59 new lows were seen on Friday. The number of new highs is indicative of a market overbought but enthusiastically being purchased by investors. Friday was a very bullish day for stocks.
Market Direction Closings For Oct 31 2014
The S&P closed at 2018.05 up 23.40. The Dow closed at 17,390.52 up 195.10. The NASDAQ closed at 4630.74 up 64.60.
The Russell 2000 IWM ETF moved higher closing up $1.69 to close at $116.56 as it continues to recover.
Market Direction Technical Indicators At The Close of Oct 31 2014
Let’s review the market direction technical indicators at the close of Oct 30 2014 on the S&P 500 and view the market direction outlook for Oct 31 2014.
Market Direction Technical Analysis for Oct 31 2014
Stock Chart Comments: Stocks had an excellent day on Friday with heavy volume, new highs and over 300 stocks setting new 52 week highs. This as you can see in the chart above is placing stocks in a very overbought environment. Stocks that are rising tend to draw in investors and that is what we saw often during the week. The Upper Bollinger Band is now widening away from the Lower Bollinger Band and the 20 day EMA is starting to turn back up and should cross up and over the 100 day EMA shortly, signaling an end to the correction and confirming the trend up..
Strong Support Levels are at 1870 and 1840. Both levels are strong enough to delay the market falling. 1930 was given up yesterday. 1956 and 1970 are back as support for stocks. 2000 is the highest level of support at present and while not strong, it should have enough strength to hold sellers back for at least a day in the event of an interim pullback. I am not expecting this to happen at this stage of the rally.
The other two support levels not shown in the chart above are 1775 and 1750. I have explained that these two are critical support for the present bull market. While 1775 is important it is 1750 that is now the bottom line.
A break of 1750 would mark a severe correction of more than 13% from the most recent high. This would be the biggest correction since April 2012. A pull-back of that size would definitely stun investors at this point and it is not something I am anticipating at this time.
Momentum: For Momentum I am using the 10 period. Momentum is still positive and rising toward being overbought.
MACD Histogram: For MACD Histogram, I am using the Fast Points set at 13, Slow Points at 26 and Smoothing at 9. MACD (Moving Averages Convergence / Divergence) issued a buy signal on October 22 which was confirmed on the 23rd. MACD is continuing to gain strength.
Ultimate Oscillator: The Ultimate Oscillator settings are: Period 1 is 5, Period 2 is 10, Period 3 is 15, Factor 1 is 4, Factor 2 is 2 and Factor 3 is 1. These are not the default settings but are the settings I use with the S&P 500 chart set for 1 to 3 months. The Ultimate Oscillator is positive and extremely overbought.
Rate of Change: Rate Of Change is set for a 21 period. The rate of change is staying positive and confirming the trend change to up.
Slow Stochastic: For the Slow Stochastic I use the K period of 14 and D period of 3. As the Slow Stochastic tries to predict the market direction further out than just one day. The Slow Stochastic is signaling market direction is up but it is extremely overbought and the signal lines are close enough that we could see a pullback on Monday.
Fast Stochastic: For the Fast Stochastic I use the K period of 20 and D period of 5. These are not default settings but settings I set for the 1 to 3 month S&P 500 chart when it is set for daily. The Fast Stochastic is still signaling up for stocks as well, but it too is extremely overbought and the signal lines are close enough in their readings that stocks look set to turn sideways.
Market Direction Outlook And Strategy for Nov 3 2014
The first trading day of November has been negative in the majority of years since 1990. With stocks so deeply overbought and the stochastic indicators showing very close signal lines, we could see sideways action on Monday.
For Monday I am expecting sideways action but probably a positive close simply because of the heavy volume last week. Investors are back buying stocks and they will definitely push the stock market higher.
Stay FullyInformed With Email Updates
Market Direction Internal Links
Profiting From Understanding Market Direction (Articles Index)
Understanding Short-Term Signals
Market Direction Portfolio Trades (Members)