
The market rallied on Tuesday on the news of an agreement of sorts between Russia, Saudi Arabia, Venezuela and Qatar on oil product limits. While the limits are above what most would have expected, as they really do not address the over production problem, they still do show the concern oil producers have with the price of oil in general and many investor hope it is the start of placing a bottom under the declining oil prices. That of course, remains to be seen. As well the Chinese Central Bank pegging the Yuan also had a strong positive impact for stocks.
Index Closing Prices
The indexes closed almost at their highs for the day. The S&P closed at 1,895.58 up 30.80. The Dow Jones closed at 16,196.41 up 222.57. The NASDAQ closed at 4,435.96 up 98.44
Advance Decline Numbers
Volume on fell back to 4.6 billion shares. By the close, 84% of all volume was moving to the upside. 80% of all stocks on New York were rising. New lows fell back from 139 on Friday to 57 on Tuesday. New highs were almost unchanged at 22.
Market Direction Technical Indicators At The Close
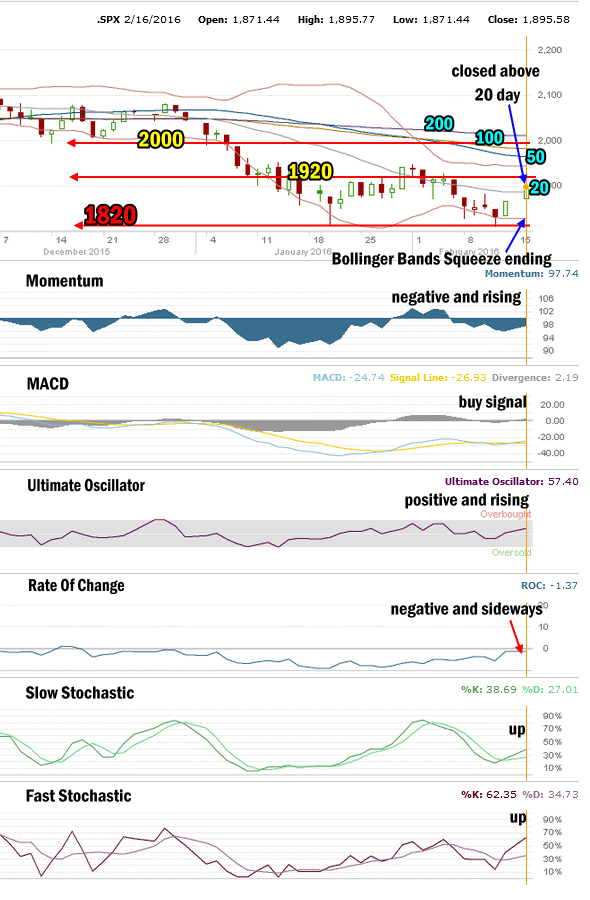
SPX Market Direction Technical Analysis for Feb 16 2016
Stock Chart Comments:
The S&P closed above the 1890 level today at 1895.58 almost at the day’s high. The index retook the 20 day simple moving average (SMA) and has a ways to go to pressure eh 50 day moving average. It was a strong showing today with the Bollinger Bands Squeeze ending and the index moving higher at the same time.
All the major moving averages are still falling and the 50 day is falling quickly away from the 100 day signaling lower prices are still ahead.
The closing candlestick is bullish, but two days of a strong rally with the market closing at the highs usually signals a pullback to start the following day before the market continues higher.
Support and Resistance Levels:
These are the present support and resistance levels. These levels have not changed since January 2015. 2100 is resistance.
2075 was light support and is also resistance. Below that is 2050 which is also resistance.
Stronger support was at 2000 which is now resistance.
Weak resistance is at 1970 while stronger resistance is at 1956 and technically it is more important than 1970 for the market. 1940 is light resistance as is 1920. 1900 is more symbolic than anything else.
1870 was resistance. 1840 continues to be support. The 1820 level is light support. The strongest support level is at 1800.
1775 and 1750 are both critical support for the present bull market. While 1775 is important it is 1750 that is the bottom line.
A break of 1750 would mark a severe correction from the all-time high of 2134.72. This would be the biggest correction since the plunge in 2011 of 271 points for a 20% pullback. A pullback to 1750 from the all-time high would be a drop of 384 points for a decline of 18%. A pull-back of that size would definitely stun investors and bring to question whether the bull market which started in 2009 is finished. From 1750 it is an easy slide to 1600 which was near the market top in 2007.
Momentum: For momentum I use a 10 period when studying market direction. Momentum is negative and rising.
MACD Histogram: For MACD Histogram, I am using the Fast Points set at 13, Slow Points at 26 and Smoothing at 9. MACD (Moving Averages Convergence / Divergence) issued a buy signal today which was fairly strong. It is not confirmed as of yet.
Ultimate Oscillator: The Ultimate Oscillator settings are: Period 1 is 5, Period 2 is 10, Period 3 is 15, Factor 1 is 4, Factor 2 is 2 and Factor 3 is 1. These are not the default settings but are the settings I use with the S&P 500 chart set for 1 to 3 months. The Ultimate Oscillator is positive and rising.
Rate of Change: Rate Of Change is set for a 21 period. The rate of change signal is negative and turned sideways which could support the outlook for some weakness in the morning on Wednesday.
Slow Stochastic: For the Slow Stochastic I use the K period of 14 and D period of 3. The Slow Stochastic tries to predict the market direction further out than just one day. The Slow Stochastic is pointing up for stocks.
Fast Stochastic: For the Fast Stochastic I use the K period of 20 and D period of 5. These are not default settings but settings I set for the 1 to 3 month S&P 500 chart when it is set for daily. The Fast Stochastic is pointing up for stocks.
Market Direction Outlook for Feb 17 2016
The technical indicators are now 4 to 2 in favor of the market advancing. The rate of change is a bit of a concern as it has not moved higher which often is an indication of erosion in the advance. As well momentum is not as strong as a rally normally is which shows that some of the rally is being caused by short sellers covering.
We have of course seen many rallies fail this year after one or two days. The outlook though remains fairly positive still although I would expect some weakness to show up Wednesday morning. Following that weakness I would expect the midday to see stocks move higher and the afternoon to see another positive close, but I would not expect a rally on Wednesday anywhere as strong as the rally from Friday and Tuesday.
For Wednesday I’ll be looking for a weak start but a higher close.
Stay FullyInformed With Email Updates
Market Direction Internal Links
Profiting From Understanding Market Direction (Articles Index)
Understanding Short-Term Signals
Market Direction Portfolio Trades (Members)
Market Direction External Links
IWM ETF Russell 2000 Fund Info
Market Direction SPY ETF 500 Fund Info