YUM Stock continues to be under pressure. A few days earlier YUM Stock had risen after selling off earlier. Now YUM Stock is back down and I decided it was time for put selling the July $57.50 put strike for .56 cents. About 1% for just less than a month. I like YUM Stock but I felt it was better to play it safe on this trade and stay far enough out of the money with the $57.50 put to give myself enough time to roll them if I have to.
YUM Stock Technical Analysis
I have been in and out of YUM Stock for years, so I have a pretty good understanding of the stock and its up and downs. I still like to take a technical look at a stock like YUM Stock to see what pressure the stock may be under and what strikes I should consider put selling.
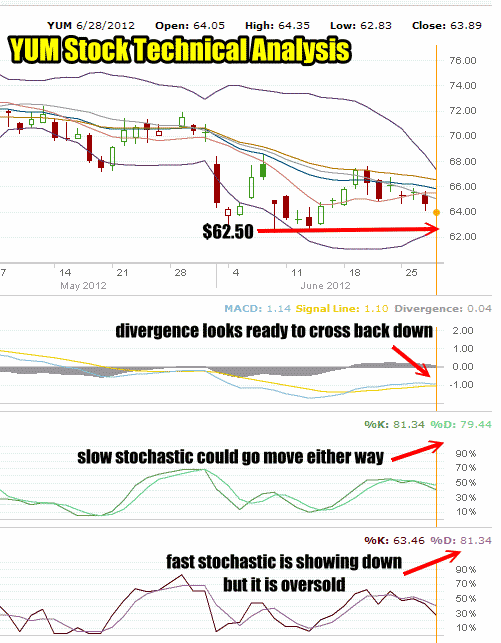
The chart below shows the recent weakness in June for YUM Stock. The stock recently touched $62.50 and recovered but basically it made a lower high. Investors remain concerned that YUM Stock’s earnings may decline with the slowdown in China and parts of Asia. There may be cause for their concern which is why I feel it better to stay a far distance from the present value. I don’t mind owning YUM Stock but I would prefer lower than $62.50.
Technically YUM Stock continues to exhibit some problems but nothing too drastic. MACD is turning down but not signalling a major decline just weakness. The Slow Stochastic is not really signalling either direction up or down. Meanwhile the fast stochastic is definitely showing down but it is now into oversold territory which could lend some support to YUM Stock at this price.
By selling at $57.50 I believe there is enough support from the technical indicators that YUM Stock may not fall that low by July Options Expiry.

Yum Stock technical analysis chart
YUM Stock One Year Chart
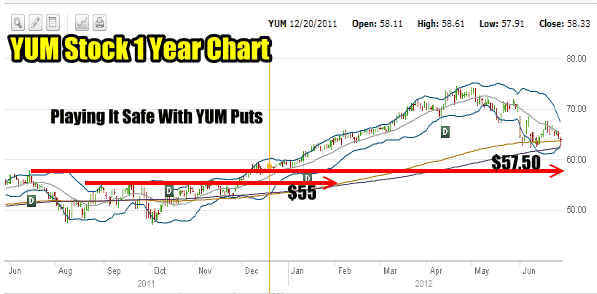
Below is the one year YUM Stock chart. You can see in the chart that there is some support at $62.50 but certainly not long-term support. There is not a lot of support at $60.00 but I believe that a lot of investors may want the stock if it falls to $60.00, after all it was trading between $72 and $74 in late April and early May. $60.00 is quite a good pullback for the stock.
Selecting The Put Selling Strike For YUM Stock
From there I felt that $57.50 was a pretty decent strike for put selling. I was put selling $57.50 back in December and there was a lot of support at that time at $57.50.
From today’s price the $57.50 strike is still quite a bit lower so there should be enough buying between $62.50 and $57.50 to slow a further decline in YUM Stock.

One Year Yum Stock Chart
Put Selling YUM Stock Summary
There could be and probably will be more selling in YUM Stock. The first pullback earlier in June is being tested again. Usually the second test is the more important one. With this put selling trade I just did 10 put contracts. I am waiting to see if the second test breaks through $62.00 before doing more put selling. My next put strike choice would be $55, but if the support holds with this test I will sell further YUM Stock puts at $57.50.

