Following my YUM Stock article last night and my put selling the $57.50 puts for 21JUL12 options expiry, this morning YUM Stock sold off more and with YUM Stock price down to $61.55 and I bought 500 shares at $61.62 for a quick bounce. I also did more YUM Stock put selling at the same strike, July $57.50, but this time for .71 cents.
The key to this trade was following stock technical analysis tools and in particular the Fast Stochastic from last night’s chart which I posted on my site.
YUM Stock and the Fast Stochastic
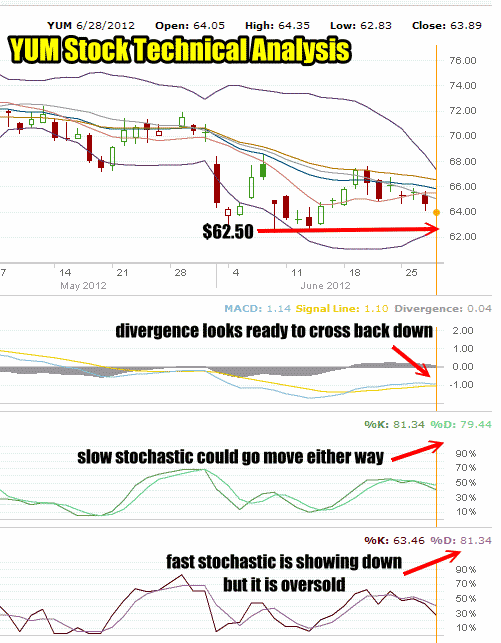
Last night’s YUM Stock technical analysis gave a number of indicators on the stock which told me to prepare for more put selling opportunities. Among those signals was also the Fast Stochastic that showed the stock was under pressure still but oversold and due for a bounce.
It is this kind of reading by the Fast Stochastic that investors can look for. I find that rather than following dozens and dozens of stocks, I simply following a handful of stocks and can profit easily by being ready for all kinds of opportunities as my handful of stock change. YUM Brands has been excellent for this type of trade and with its volatility it continues to create excellent profit-making opportunities.
Last night’s YUM Stock Technical Analysis chart is below.

Yum Stock technical analysis chart
YUM STOCK and Taking Advantage Of Stock Technical Analysis
Since last night the fast stochastic showed more downside ahead but oversold, this increases the likelihood of a bounce in the stock. It means that any selling also has an increased likelihood of an interim bounce and probably in the same day. The slow stochastic showed the stock could go either way which is perfect for this type of quick morning or afternoon trade because it is indecision that gets investors selling and buying. Investors hate whipsaws which is exactly what option sellers enjoy and benefits put selling.
MACD was set up perfectly sitting at an inflection point ready to cross over to give a stock down signal or possibly not crossing over but giving a sideways signal. Either are again perfect, because this means that the indecision among investors being reflected by MACD should give the stock some bounce.
Add In The Ultimate Oscillator
To this stock technical analysis mix I add in the Ultimate Oscillator and use my normal settings of 5, 10 and 15. The two-day chart is below. This morning the stock sold off right at the open as obviously someone wanted out of the stock.
The Ultimate Oscillator flashed oversold. I bought 500 shares at $61.62. I then turned to put selling and sold 5 more naked puts on YUM Stock for July $57.50 put strike for .71 cents.
The stock bounced and at $62.60 I sold my 500 shares. A nice quick bounce and a little tidy profit. It is amazing what a using technical analysis tools can provide for investors.
Put Selling Opportunities In YUM Stock
I believe there are lots more opportunities to come in YUM Stock. It has had a nice run up earlier this year and with investor confidence shaken a bit, I think put selling for a while anyway may be a lot more productive than in April and May when YUM Stock was overvalued. Now coming back to reasonable valuations, I keep an eye out for the same type of profit-making opportunities as appeared this morning in YUM Stock.

