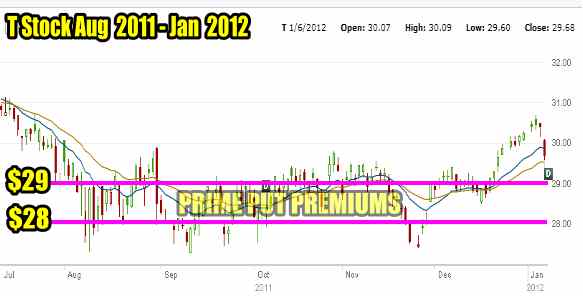
T Stock last year provided an excellent return. A full 4.1% of my entire put selling income for 2011 is directly from my T Stock trades. Today with T Stock under pressure after going X-Dividend for .44 cents, the stock closed at the low for the day. Normally this would mean I should wait for Monday to see if T stock falls lower. For those technical investors, the candlestick was a Long Black Candlestick indicating significant pressure and that the stock moved lower throughout the entire day. That is normally a warning sign telling investors that now is NOT the time to buy stock.
T Stock Timing Technical Indicators For Jan 6 2012
Below are my technical indicators for T Stock as of the close on Jan 6. They are all indicating a down move in the stock. The Rate Of Change yesterday was 5.59 and today is was 2.88. But while pointing down, remember none are negative. Indeed if I add in the .44 cent dividend to the closing price of $29.68, the stock is still at $30.12.

T Stock Technical Indicators for Jan 6 2012 show that the stock is in a down swing.
I am doing put selling on T Stock and not stock buying. As well, I am holding 10 21JAN12 $27 put contracts still. Therefore my plan is to sell the $29 put strike and then if the stock should continue to fall, sell the $28.00. I will try to hold 10 put contracts at each strike should premiums warrant selling the $28.00 put strike. On Friday they got close to 1% as they touched .22 cents. But I would prefer to see a bit higher on the $28 puts if possible.
T Stock Chart August 2011 – Jan 2012
Below is T Stock chart for the past 6 months.$29 and $28 put strikes mark the high and low for the past 6 months. I believe T Stock is undervalued and could move above $31.00 shortly. Until that time, and until a new range is established, the prime put selling premium region is those two puts. For those put sellers who are concerned about being assigned shares at $29 or $28, they could consider the $27 strike, but until volatility rises, put premiums for the $27.00 strike are poor and an investor must go out more than 2 months to realize any kind of decent premium.

T Stock chart for August 2011 to Jan 2012
T Stock Put Trade Jan 6 2012 Summation
I am not concerned about being assigned shares in T Stock at these levels. First, I doubt I will be assigned early should the stock fall below even $27.00. In my put selling experience over the past 3 decades, I have rarely been assigned shares. Covered calls are different from naked puts. With a covered call, if the underlying stock pays a dividend then the chance of assignment once the call falls into the money, is higher when the dividend is being paid. If the paid out dividend is higher than the premium in the covered call, then normally the stock will be exercised for the dividend earnings. With put selling there is rarely the time when the shares are assigned unless you are nearing expiry and the puts are deep in the money. That’s a clear sign to roll those puts forward unless you want to be assigned. This T Stock link looks at a 5 year Yahoo chart in T Stock which shows how the stock has a long way to climb to enter over-valued territory.
With T Stock stuck in this range which I have marked in the chart above, I believe this is a compelling put selling opportunity for the present. For investors who prefer buying and selling stock, this range in T Stock could also prove quite profitable.

