
With the stock market possibly entering a period of higher volatility I am releasing a series of articles entitles “Strategies For A Pullback”. The focus of this series is to both profit from stock market downturns and higher volatility as well as protect capital in use. The first article looks at how using the heatmap can assist in profiting from plunges.
When the stock markets take more than a dip, there are a lot of tools available to the investor to assist in timing trades and understanding the best course of action to be taking when profiting from a downturn in the market direction. The biggest problem though is getting that information quickly and being able to understand what is happening, within seconds. Investing today continues to improve as more and more information is made available to investors about almost every aspect of an index, a stock, a sector, a marketplace, a commodity, trends and much more. But with all that information, investors need a way to quickly know and understand how to react to the investing market and climate they are faced with and how to profit from it.
Profit From The Plunge
When markets plunge, enormous profits can be made simply. The best products I have found to invest in is the SPY PUT Options, and the Ultra Short 3 Times ETFs such as the SDOW (ultra short Dow), SQQQ (Ultra Short NASDAQ 100) or SPXU (Ultra Short S&P). There are other products and each investor will have a favorite product. I find the products I mentioned have high liquidity and tight trading which makes them ideal for trading plunges.
Heatmaps Can Be Indispensable
The problem for many investors though is understand just how strong the downward move is in stocks. This is where Stock Heatmaps play an important role. While during periods of low volatility heatmaps play a less important role, on days of big point downswings like Thursday and Friday, heatmaps can become indispensable.
Check With Your Broker
There are numerous sources for heatmaps that follow stocks and most discount brokers offer their own versions which cost nothing as they should be included in your account fees. I use the FINVIZ.com website and pay a monthly fee but primarily because I have used them for so long they are part of my investing world. For most investors a paid service like FINVIZ is not required and I do not make any kind of recommendation that investors pay for a subscription as I believe it is unnecessary. There are many free sources of heatmaps and the first place to check is with your broker.
What Is A Heatmap
A heatmap is basically a graphical representation of data to show individual values at a specific point in time in a matrix design in various colors. Heat maps are available to cover all kinds of different aspects of life on earth. It is the stock market heatmaps that I use.
Below is a typical stock heatmap. The heatmap is ideal for understanding what is happening in the market place at a moments notice because the colors provide an instant analysis of the momentum at the moment.
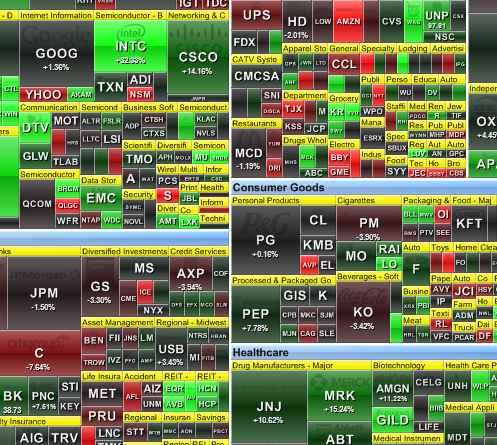
A typical heatmap provides at a glance the momentum behind stocks and sectors.
Advantages Of Stocks Heatmap
- In a decline it can help to calm nerves and control emotions as it gives a full graphical representation of just how severe the selling is at any given moment. What might seem severe may actually not be as “bad” as originally thought.
- In a decline a heatmap gives an instant overview in real-time of the entire stock market at a glance
- In a decline a heatmap gives an instant overview of which sectors are being hit the hardest for instant analysis. This allows for even more targeted trading against those sectors particularly being hammered such as the financial sector in the credit crisis. This can boost up profits quickly.
- In a decline the color representation gives an immediate understanding of how intense the selling is, how general it is, or how localized it might be to particular sectors.
- In a decline the heatmap can be maintained on a portion of a monitor or on a separate monitor or computer to allow for watching the color representation changes
- In a decline the heatmap allows for instant snap decisions to be made.
- In a decline the heatmap can be used to confirm trade decisions already made.
Profiting From Plunges – Role Of The Heatmap
Here is how I use stock heatmaps to profit from plunges as well as protect my capital from volatility and risk of loss. The rest of this article is for members. This strategy discussion which looks at profiting from stock market plunges such as we saw on July 31 and August 1 2014 is 2600 words and will require 11 pages if printed.
FullyInformed USA Members can can review this strategy article directly through this link or they can sign in to the full USA members site here. Non-members can join here or read about the benefits of being a member.
Disclaimer: There are risks involved in all investment strategies and investors can and do lose capital. Trade at your own risk. Stocks, options and investing are risky and can result in considerable losses. None of the strategies, stocks or information discussed and presented are financial or trading advice or recommendations. Everything presented and discussed are the author’s own trade ideas and opinions which the author may or may not enter into. The author assumes no liability for topics, ideas, errors, omissions, content and external links and trades done or not done. The author may or may not enter the trades mentioned. Some positions in mentioned stocks may already be held or are being adjusted.
Stay FullyInformed – Subscribe For Updates
Review Portfolios:
Review All Portfolios for US Stocks
Review All Portfolios for Canada Stocks
Review All Retirement Portfolios
SELECT TO REVIEW ALL MY STOCKS
Internal Stock and Option Trades Links
Put Selling Strategies For Members
Covered Calls Strategies For Members
Profit And Income Strategies Index
Stock and Option Strategies For Members
Stock And Option Trades Explained For Members