
Prior Trading Day Summary
On Mon Sep 14 2026 investor mulled over warnings about “slowing down” AI development along with 10 year bond yields reaching 5% as oil moved higher yet again. Yet despite all of this, selling was mild and the indexes did not lose a lot of ground.
The SPX fell 37 points to close at 7620 which kept the index in a sideways trend rather than actually moving lower. Volume was 5.1 billion shares traded with 56% of all volume moving lower and 58% of stocks on the index lower by the close. There were 265 new 52 week lows on Monday.
The NASDAQ lost 174 points to close at 26,186, near where the index was at the start of September. Trading volume was modest at 7.5 billion shares with 50% of volume moving lower and 54% of all stocks lower by the close. There were 400 new 52 week lows on Monday which was the second highest number of new lows since March 20.
Let’s review the SPX closing technical indicators from Mon Sep 14 2026 to see what they predict for Tue Sep 15 2026.
Prior Trading Day Earned Income
On Mon Sep 14 2026 there were 10 trades with a total income earned of $5867. Perhaps of most interest was a trade in Alphabet Stock (GOOGL), one inJP Morgan Chase Stock (JPM) and a trade done in the IWM ETF. Members can review all of Monday’s trades through this list.
End of Summer Sale Extended to Wed Sep 16 2026
By request from a number of members, the End of Summer Special has been extended to Wed Sep 16 which should help investors who may have been away this past weekend.
Stock Market Outlook: SPX Closing Chart For Mon Sep 14 2026
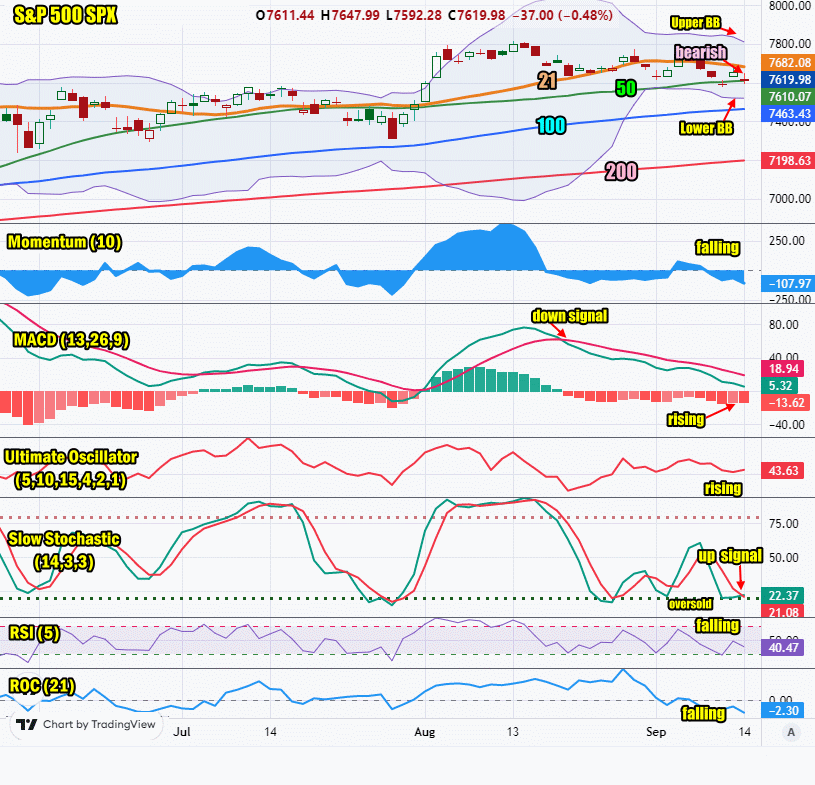
The index ended the day below the Upper Bollinger Band and below the 21 day moving average but it managed to hold onto the 50 day moving average. This though is still bearish.
The closing candlestick is bearish for Tuesday but the long shadow at the close on the SPX final candlestick is signaling a good chance for a large bounce today.
The 21 day moving average is falling and closed at 7682. This is bearish.
The 50 day moving average is rising and closed at 7610. This is bullish.
The 100 day moving average is rising and closed at 7463. This is bullish.
The 200 day moving average is rising and closed at 7198. This is bullish.
The Lower Bollinger Band is above the 100 day and below the 50 day moving average. It is falling lower. This is bearish. The Upper Bollinger Band is falling which is bearish. Signals are advising stocks are in a Bollinger Bands Squeeze that may be ending with stocks set to fall lower.
The SPX chart is more bearish than bullish for Tue Sep 15 2026..
SPX Stock Market Outlook review of Mon Sep 14 2026
Stock Market Outlook: Technical Indicators Review
Momentum: Momentum is falling and negative. It is bearish.
|
MACD Histogram: MACD (Moving Averages Convergence / Divergence) issued a down signal on Thu Aug 20 2026. On Mon Sep 14 2026 the down signal gained strength.
|
Ultimate Oscillator: The Ultimate Oscillator is rising but bearish.
|
Slow Stochastic: The Slow Stochastic has n up signal in place from being oversold.
|
Relative Strength Index: The RSI signal is falling which is bearish.
|
| Rate of Change: The rate of change is falling and signaling that Tuesday will end lower. Settings: Rate Of Change is set for a 21 period. This indicator looks back 21 days and compares price action from the past to the present. With the Rate Of Change, prices are rising when signals are positive. Conversely, prices are falling when signals are negative. As an advance rises, the Rate Of Change signal should also rise higher, otherwise the rally is suspect. A decline should see the Rate Of Change fall into negative signals. The more negative the signals the stronger the decline. |
Stock Market Outlook: Support and Resistance Levels |
| 7800 is resistance |
| 7780 is resistance |
| 7750 is resistance |
| 7700 is resistance |
| 7650 is resistance |
| 7600 is resistance |
| 7590 is resistance |
| 7570 is resistance |
| 7550 is resistance |
| 7500 is support |
| 7450 is support |
| 7425 is support |
| 7400 is support |
Stock Market Outlook for Tue Sep 15 2026
Despite everything thrown at stocks on Monday, the indexes held together and losses were light. Investors remain committed to the market at present and as long as earnings continue to surprise with their strength, investors are unlikely to leave stocks. On Tuesday there are signals advising that a larger bounce is likely. At the same time there are also signals advising that the index will end the day lower ahead of the Fed’s interest rate decision due out on Wednesday afternoon.
Potential Economic and Political Market Moving Events
Monday:
No reports
Tuesday:
8:30 Empire State Manufacturing Survey is estimated to fall to a reading of 15, down from 20.6 prior.