
 Prior Trading Day Summary
On Tue Nov 18 2025 stocks continued to stay under selling pressure. Not all stocks on New York were falling. Instead 52% were rising and 60% of all volume was also advancing by the close.
The S&P fell 55 points to close at 6617. Volume was 5.2 billion shares, roughly 100 million shares less than Monday’s trading. Signs pointed to some exhaustion after 4 straight days of selling.
The NASDAQ fell 275 points to close at 22,432. Volume was lower by 1.2 billion shares, falling to 8.8 billion. 56% of all volume was being traded higher while 48% of stocks were rising despite the selling. Signs on the NASDAQ point to investors shopping through the sell-off stocks and locking for bargains.
Let’s review the closing technical indicators from Tue Nov 18 2025 to see what Wed Nov 19 2025 brings ahead of NVIDIA earnings due out today after the close.
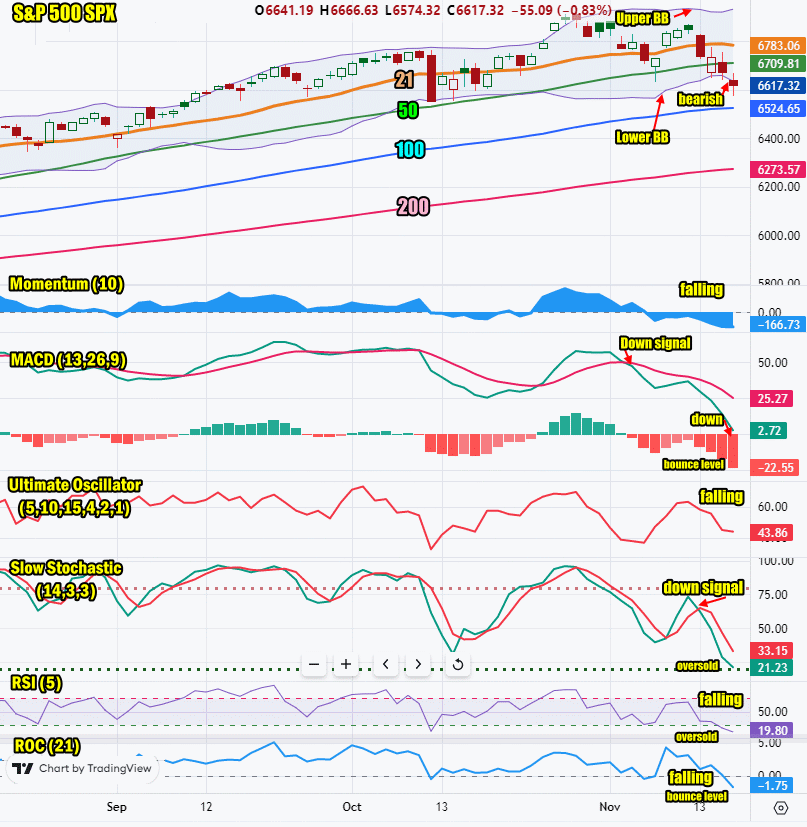
Stock Market Outlook: SPX Closing Chart For Tue Nov 18 2025
The index closed below the Lower Bollinger Band and below the 50 day moving average. This is bearish and marks a drop of 4.38% below its 52 week high made Oct 29. To date this is a typical correction in an ongoing bull market.
The closing candlestick is bearish but pointing to a bounce from being oversold.
The 21 day moving average is falling and closed at 6783 which is bearish.
The 50 day moving average is rising and closed at 6709 which is bullish.
The 100 day moving average is rising and closed at 6524 which is bullish.
The 200 day moving average is rising and closed at 6273 which is bullish.
The Lower Bollinger Band is below the 50 day moving average and falling which is bearish. The Upper Bollinger Band is rising signaling the market is falling. This is bearish. A chance of a Bollinger Bands Squeeze is over.
The SPX chart has more bearish signals for Wednesday but points to a high possibility of an oversold bounce.
SPX Stock Market Outlook review of Tue Nov 18 2025
Stock Market Outlook: Technical Indicators Review
Momentum: Momentum is falling and negative.
|
MACD Histogram: MACD (Moving Averages Convergence / Divergence) issued a down signal on Wed Nov 5. On Tue Nov 18 2025 the down signal was much stronger but reading are now into bounce levels where a bounce is highly likely.
|
Ultimate Oscillator: The Ultimate Oscillator is falling.
|
Slow Stochastic: The Slow Stochastic has a sharp down signal. It is now at oversold levels.
|
Relative Strength Index: The RSI signal is falling sharply and is oversold.
|
| Rate of Change: The rate of change is falling and at oversold levels where a bounce is likely. Settings: Rate Of Change is set for a 21 period. This indicator looks back 21 days and compares price action from the past to the present. With the Rate Of Change, prices are rising when signals are positive. Conversely, prices are falling when signals are negative. As an advance rises, the Rate Of Change signal should also rise higher, otherwise the rally is suspect. A decline should see the Rate Of Change fall into negative signals. The more negative the signals the stronger the decline. |
Stock Market Outlook: Support and Resistance Levels |
| 6900 is resistance |
| 6875 is resistance |
| 6850 is resistance |
| 6800 is resistance |
| 6775 is resistance |
| 6750 is resistance |
| 6715 is resistance |
| 6700 is resistance |
| 6675 is resistance |
| 6650 is resistance |
| 6625 is resistance |
| 6600 is support |
| 6590 is support |
| 6570 is support |
| 6550 is support |
| 6500 is support |
| 6450 is support |
| 6425 is support |
| 6400 is support |
Stock Market Outlook for Wed Nov 19 2025
For Wed Nov 19 2025 there indicators are all signaling down but most are now oversold and at levels where a bounce is likely.
Wednesday could see a bit more selling but investors appear exhausted for now. Most investors will be watching NVIDIA (NVDA) earnings after the close today. If earnings fail to meet estimates, there is a high chance of the sell-off deepening. However if their earnings beat by a wide margin, watch for investors to enter stocks on Thursday and push indexes higher.
On Wednesday investors also get the latest FOMC minutes which most analysts and investors expect will show a 50/50 split for a possible December rate decrease.
Potential Economic and Political Market Moving Events
Monday:
8:30 Empire State manufacturing survey stunned analysts coming in at 18.7, three times higher than estimates of 5.5
Tuesday:
9:15 Industrial production no data released
10:00 Factory orders rose 1.4%, better than expected
10:00 Home builder confidence index rose to 38 from 37 prior.