
On Tuesday indexes struggled throughout the day but by the close the SPX was virtually unchanged and the NASDAQ had added in a few points as investors wait for the debt ceiling vote to take place.
The S&P gained 0.07 points and ended the day unchanged at 4205. Volume rose to 4.3 billion.
The NASDAQ gain 41 points to end the day at 13,017, the highest close since August 2022. Volumerose to 4.9 billion shares traded.
Let’s review the SPX closing technical indicators on Tue May 30 to see what to expect if stocks will rally higher on Wednesday, the final trading day of May 2023.
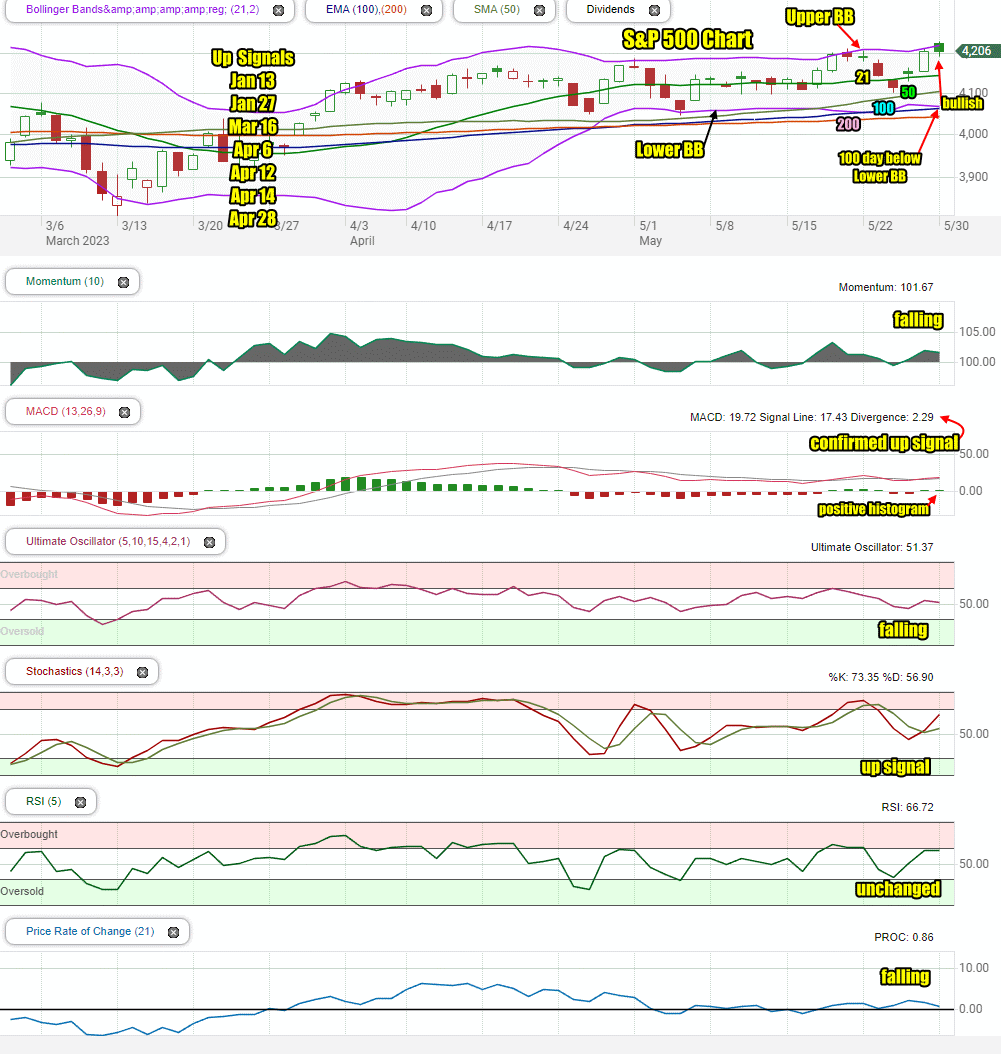
Stock Market Outlook Chart Comments At The Close on Tue May 30 2023
The index closed unchanged but once again with a bullish candlestick for Wednesday.
The SPX continues above the 21 day moving average and pressuring the Upper Bollinger Band higher. This is bullish.
The 100 day moving average has fallen below the Lower Bollinger Band which is bearish although the Lower Bollinger Band looks set to fall back below the 100 day which would be bullish.
The 50 and 100 day moving averages are rising which is bullish.
The S&P chart is more bullish than bearish for Wednesday.
There are 7 up signal since January and no down signal in the chart.
Stock Market Outlook review of Tue May 30 2023
Stock Market Outlook: Technical Indicators Review:
Momentum: Momentum is falling and positive.
- Settings: For momentum I use a 10 period when studying market direction.
MACD Histogram: MACD (Moving Averages Convergence / Divergence) issued an up signal on Friday May 26. The up signal was confirmed on Tuesday. The MACD histogram is also positive.
- Settings: For MACD Histogram, I am using the Fast Points set at 13, Slow Points at 26 and Smoothing at 9.
Ultimate Oscillator: The Ultimate Oscillator is falling and positive.
- Settings: The Ultimate Oscillator settings are: Period 1 is 5, Period 2 is 10, Period 3 is 15, Factor 1 is 4, Factor 2 is 2 and Factor 3 is 1. These are not the default settings but are the settings I use with the S&P 500 chart set for 1 to 3 months.
Slow Stochastic: The Slow Stochastic has an up signal in place.
- Settings: For the Slow Stochastic I use the K period of 14 and D period of 3. The Slow Stochastic tries to predict the market direction further out than just one day.
Relative Strength Index: The RSI signal is unchanged and positive. It is nearing overbought.
- Settings: The relative strength index is set for a period of 5 which gives it 5 days of market movement to monitor. It is often the first indicator to show an overbought or oversold signal.
Rate of Change: The rate of change signal is falling but positive.
- Settings: Rate Of Change is set for a 21 period. This indicator looks back 21 days and compares price action from the past to the present. With the Rate Of Change, prices are rising when signals are positive. Conversely, prices are falling when signals are negative. As an advance rises the Rate Of Change signal should also rise higher, otherwise the rally is suspect. A decline should see the Rate Of Change fall into negative signals. The more negative the signals the stronger the decline.
Support and Resistance Levels To Be Aware Of:
4250 is resistance
4240 is resistance
4225 is resistance
4210 is resistance
4200 is resistance
4190 is resistance
4180 is resistance
4175 is resistance
4150 is resistance
4135 is resistance
4125 is support
4100 is support
4090 is support
4075 is support
4050 is support
4030 is light support
4025 is light support
4000 is support
Stock Market Outlook for Wed May 31 2023
For Wednesday the S&P chart is bullish for another attempt to close higher, above the 4200 level.
The technical indicators are mixed with a number now pointing lower after Tuesday’s sideways day, however the MACD technical indicator confirmed Friday’s up signal.
With many investors waiting for the debt ceiling vote, we could see another day with some weakness on Wednesday but the technical indicators are still advising there is a good percentage the index will close higher, even if only slightly.
Potential Economic and Political Market Moving Events
The debt ceiling will dominate for much of this week but despite negative comments and those who say they will not vote for the “deal”, there is little chance this will not be passed.
On Wednesday the Fed’s Beige Book could see the index rise in the hour before 2:00 and then slip back after 2:00 PM.
Wednesday:
9:45 Chicago business barometer which is expected to come in lower at 47.3
10:00 Job openings are expected to come in at 9.5 million.
2:00 Federal Reserve Beige Book