
Stock Market Summary for Tue May 29 2018
Tuesday saw a significant pullback in all three major indexes with the Dow taking the worst hit, falling 1.58% for a 391 point drop and the S&P down 1.16% and closing below 2700. It wasn’t North Korea but Italy which unhinged investors on Tuesday as talk of Italy leaving the Euro gave investors the jitters. The indexes closed off their lows but the end of the day still saw some ugly losses with the S&P and Dow Indexes.
Closing Statistics from Tue May 29 2018
The S&P fell 31.47 to 2689.86
The NASDAQ Composite fell 37.26 to 7396.59
The Dow Jones Industrial Average fell 391.64 to 24,361.45
Stock Market Outlook Chart Comments At The Close on Tue May 29 2018
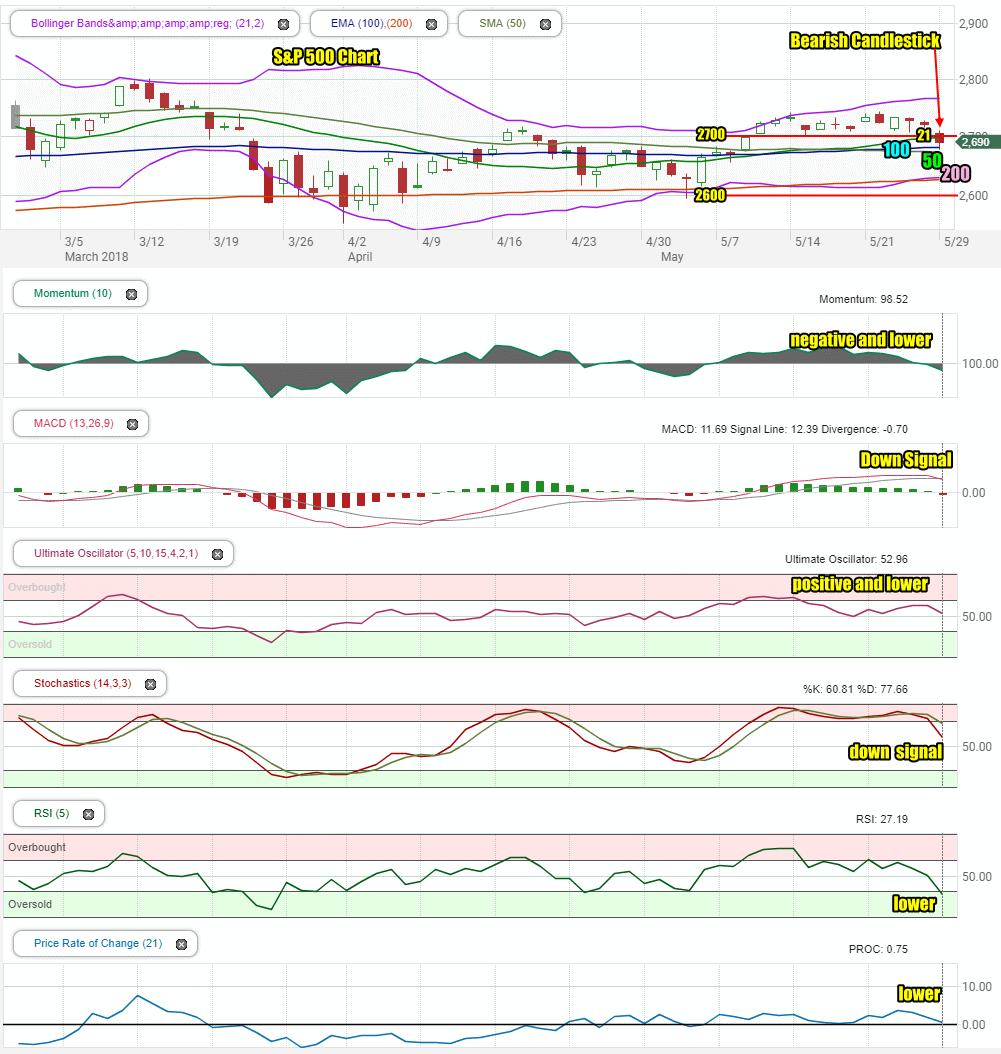
The S&P closed back below the 21 day moving average. It reached the 100 day during the selling but managed to recover to close above it. The 50 day moving average is still moving lower. The 200 day is still climbing.
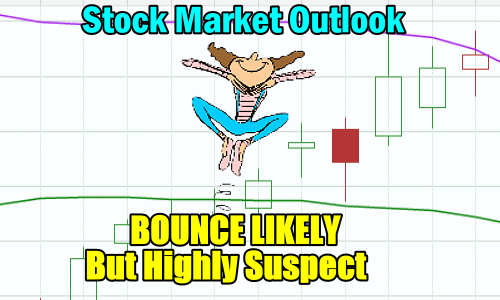
The closing candlestick is bearish for Wednesday but is often associated with a bounce attempt before another move lower occurs.
Both the Upper Bollinger Band and Lower Bollinger Band are moving higher which is bullish. This will change if the index slips further this week.
Stock Market Outlook review of Tue May 29 2018
Stock Market Outlook: Technical Indicators Review:
Momentum: For momentum I use a 10 period when studying market direction. Momentum is negative and moving lower.
MACD Histogram: For MACD Histogram, I am using the Fast Points set at 13, Slow Points at 26 and Smoothing at 9.MACD (Moving Averages Convergence / Divergence) issued an up signal on May 7. On Tue May 29 2018 MACD issued an unconfirmed down signal.
Ultimate Oscillator: The Ultimate Oscillator settings are: Period 1 is 5, Period 2 is 10, Period 3 is 15, Factor 1 is 4, Factor 2 is 2 and Factor 3 is 1. These are not the default settings but are the settings I use with the S&P 500 chart set for 1 to 3 months. The Ultimate Oscillator signal is positive and moving lower.
Slow Stochastic: For the Slow Stochastic I use the K period of 14 and D period of 3. The Slow Stochastic tries to predict the market direction further out than just one day. The Slow Stochastic has a down signal in place and is not overbought.
Relative Strength Index: The relative strength index is set for a period of 5 which gives it 5 days of market movement to monitor. It is often the first indicator to show an overbought or oversold signal. The RSI signal is moving lower and starting to enter oversold readings.
Rate of Change: Rate Of Change is set for a 21 period. This indicator looks back 21 days and compares price action from the past to the present. With the Rate Of Change, prices are rising when signals are positive. Conversely, prices are falling when signals are negative. As an advance rises the Rate Of Change signal should also rise higher, otherwise the rally is suspect. A decline should see the Rate Of Change fall into negative signals. The more negative the signals the stronger the decline. The rate of change signal is lower but clinging to positive.
Support Levels To Be Aware Of:
2745 to 2750 was light support
2725 is light support.
2700 is support.
2675 is light support.
2650 is light support
2620 is light support
2600 is strong support.
There is good support at the 2550 level from where the market bounced back from the recent correction low on Feb 9.
The S&P has light support at 2480. It also has light support at 2450 and good support at 2425. Below that there is some support at 2400, 2380, 2350. 2300 has the most support at present but would represent a full correction as a drop to this level would be 20% and just 5% away from a potential bear market signal.
Stock Market Outlook for Tomorrow – Wed May 30 2018
Once again it was geopolitical events that weighed on stocks and sent them lower on Tuesday. This changed all the signals from the technical indicators. All are moving lower and two have down signals in place. The Relative Strength Index (RSI) is moving into oversold readings which usually means a bounce should be expected. However if there is a bounce on Wednesday it will be short-lived and very suspect.
The SPX index will continue to stay under selling pressure and will end the day lower on Wednesday.
Stock Market Outlook Archives
Stock Market Outlook For Wed May 6 2026 – Choppy But Higher Still

Morning Investing Strategy Notes for Tue May 5 2026

Stock Market Outlook For Tue May 5 2026 – Overbought and Lower

Morning Investing Strategy Notes for Mon May 4 2026
Stock Market Outlook For Mon May 4 2026 – Dips Likely With Possible Lower Close

Morning Investing Strategy Notes for Fri May 1 2026
Stock Market Outlook For Fri May 1 2026 – Overbought But Higher

Morning Investing Strategy Notes for Thu Apr 30 2026
Stock Market Outlook For Thu Apr 30 2026 – Dips Likely Possible Lower Close
Morning Investing Strategy Notes for Wed Apr 29 2026
Stock Market Outlook For Wed Apr 29 2026 – Choppy But Higher Ahead Of More Earnings

Morning Investing Strategy Notes for Tue Apr 28 2026