

Prior Trading Day Summary:
On Tue May 20 2025 investors were in a wait-and-see mode after earnings from Home Depot Stock (HD) missed estimates and came in lower than the same quarter last year. Revenue however rose to $39.9 billion, beating last year’s $36.4 billion however the company indicated they were not considering raising prices due to tariffs. Home Depot Stock (HD) closed lower at $377.05 but during the day it rose to $389.75. This weighed on investors who decided to take profits, particularly in tech names, once again.
The SPX closed down just 23 points to 5940. There were 84 new highs despite 59% of all stocks falling.
The NASDAQ fell a modest 72 points to 19142. There were 152 new highs on 9.4 billion shares traded and just 15 new lows. Despite the slight loss, 56% of all trades were to the upside but 50% of stocks were falling.
With more retailers reporting tomorrow (Wed May 21 2025) lets review the technical indicators from the close on Mon May 19 2025 to see what we should expect for Tue May 20 2025.
Memorial Day Membership Sale
Due to popular request there will be a Memorial Day Special starting this weekend.
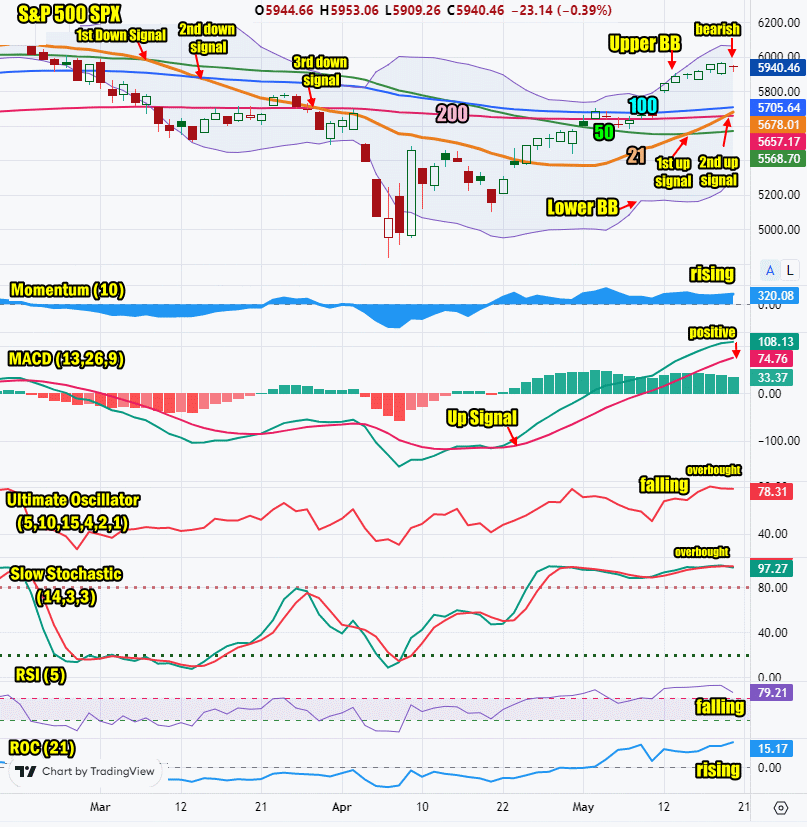
Stock Market Outlook: SPX Closing Chart For Tue May 20 2025
The index closed above all major moving averages but below the Upper Bollinger Band. This signals overbought. The index is continuing to drift sideways.
The closing candlestick is bearish with a long shadow at the close. Dips should again be expected but sometime stocks can surprise to the upside.
The 21 day moving average is rising and closed at 5678 which is bullish. At the close today, the 21 day moved above the 200 day for a major up signal. This wipes out the 4th down signal. On Wednesday May 14 the 21 day crossed above the 50 day, the first up signal from the 21 day moving average. This reversed the 5th down signal in the SPX chart.
The 50 day moving average is rising and closed at 5568 which is bullish. The 50 day moving average fell below the 100 day on Tue April 15 which issued a 4th down signal on the SPX and the 200 day on Apr 25 for a 5th down signal. Both of these down signals are now removed with the 21 day climbing back above the 200 day..
The 100 day moving average is rising and closed at 5705 which is bullish.
The 200 day moving average is rising and closed at 5657 which is bullish.
The Lower Bollinger Band is turning higher which is bullish. The Upper Bollinger Band is turning sideways which could be signaling a larger dip is coming. We will know more in a day or two.
For Wed May 21 2025 the SPX chart is more bullish than bearish but there are more signs of weakness in the chart than we saw on Monday.
SPX Stock Market Outlook review of Tue May 20 2025
Stock Market Outlook: Technical Indicators Review
Momentum: Momentum is rising and positive.
|
MACD Histogram: MACD (Moving Averages Convergence / Divergence) issued an up signal on Tue Apr 22 2025. On Tue May 20 2025 the up signal lost some strength for a third straight day signaling weakness is growing..
|
Ultimate Oscillator: The Ultimate Oscillator is falling and overbought.
|
Slow Stochastic: The Slow Stochastic has a down signal at the close and is overbought.
|
Relative Strength Index: The RSI signal is falling and no longer overbought.
|
| Rate of Change: The rate of change signal is rising signaling a larger move is anticipated for Wednesday. Settings: Rate Of Change is set for a 21 period. This indicator looks back 21 days and compares price action from the past to the present. With the Rate Of Change, prices are rising when signals are positive. Conversely, prices are falling when signals are negative. As an advance rises, the Rate Of Change signal should also rise higher, otherwise the rally is suspect. A decline should see the Rate Of Change fall into negative signals. The more negative the signals the stronger the decline. |
Stock Market Outlook: Support and Resistance Levels |
| 6000 is resistance |
| 5990 is resistance |
| 5975 is resistance |
| 5950 is resistance |
| 5925 is resistance |
| 5900 is resistance |
| 5850 is resistance |
| 5800 is resistance |
| 5785 is resistance |
| 5750 is support |
| 5700 is support |
| 5650 is support |
| 5630 is support |
| 5600 is support |
| 5550 is support |
| 5500 is support |
| 5475 is support |
| 5450 is support |
| 5400 is support |
Stock Market Outlook for Wed May 21 2025
For Wednesday the day starts with a new up signal from the 21 day moving above the 200 day. This is a major up signal. Unfortunately we are also seeing the MACD technical indicator falling for a third straight day which signals a growing weakness in the uptrend.
The morning starts with earnings from Target, Baidu, TJX and Lowes to mention 4 of the largest retailers reporting today. If they meet or beat estimates there is a good chance the index could rally, but if they miss estimates, the index could end lower.
The technical indicators are also showing some weakness but overall it is trending sideways as it works out the recent rally before moving higher. At present, dips in stocks, especially deeper ones are still opportunities, but the index is reaching a point where it should move higher or could fall back. Often an index that drifts sideways after a big rally, eventually moves higher. The Upper Bollinger Band along with the technical indicators are signaling that may not happen this time around but I think there is a better chance for another leg higher shortly. Hopefully I haven’t cursed the rally.
My community lost power all day on Tuesday starting around 8:30, which meant I was unable to post trades. Some of the trades I placed earlier in the day before the open got a few filled. Power was restored around 10:00 PM and I am posting trades completed, this evening. Hopefully the power remains on today.
Potential Economic and Political Market Moving Events
Monday:
10:00 Leading economic indicators dipped more than estimated to -1.0% from -0.8% prior
Tuesday:
No econo0mic reports
Wednesday:
No econo0mic reports