

Prior Trading Day Summary:
On Tue Jun 24 2025 investors celebrated the end of fighting between Israel and Iran as well as lower oil prices but pushing stocks higher in a broad-based rally.
The S&P ended the day up 67 points to close at 6092, the highest close since February. Over the past two days the S&P is up 124 points.
The NASDAQ rose 281 points to close at 19912. 80% of the trading volume was to the upside and 74% of stocks were rising.
Lets review the SPX technical indicators from the close on Tue Jun 24 2025 to see what we should expect for Wed Jun 25 2025.
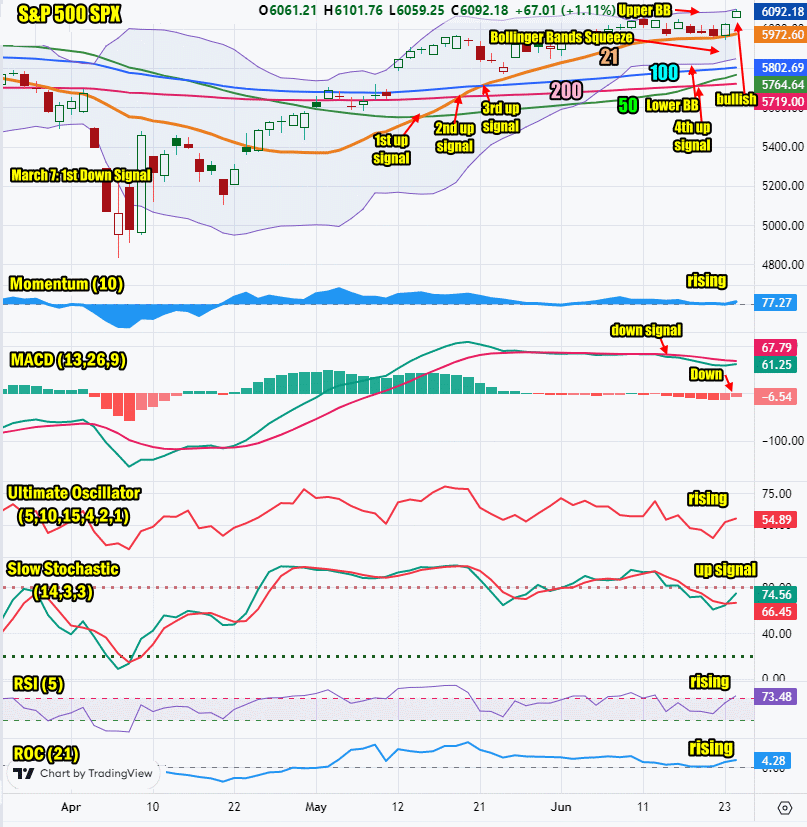
Stock Market Outlook: SPX Closing Chart For Tue Jun 24 2025
The index closed higher at the Upper Bollinger Band. This is bullish.
The closing candlestick is bullish for Wednesday.
The 21 day moving average is rising and closed at 5972 which is bullish.
The 50 day moving average is rising and closed at 5764 which is bullish. The 50 day is above the 200 day moving average for a 4th up signal. This wiped out the 2nd down signal from March. Only one down signal remains from March 7.
The 100 day moving average is rising and closed at 5802 which is bullish.
The 200 day moving average is rising and closed at 5719 which is bullish.
The Lower Bollinger Band is above the 100 day and rising which is bullish. The Upper Bollinger Band is rising which is bullish. The Bollinger Bands Squeeze is showing signs it may end with stocks higher.
The SPX chart is more bullish than bearish.
SPX Stock Market Outlook review of Tue Jun 24 2025
Stock Market Outlook: Technical Indicators Review
Momentum: Momentum is rising and barely positive.
|
MACD Histogram: MACD (Moving Averages Convergence / Divergence) issued a down signal on Fri May 30. The down signal lost a lot of strength on Tuesday which is readily evident in the chart.
|
Ultimate Oscillator: The Ultimate Oscillator is rising.
|
Slow Stochastic: The Slow Stochastic has an up signal in place.
|
Relative Strength Index: The RSI signal is rising.
|
| Rate of Change: The rate of change signal is rising signaling Wednesday will end higher. Settings: Rate Of Change is set for a 21 period. This indicator looks back 21 days and compares price action from the past to the present. With the Rate Of Change, prices are rising when signals are positive. Conversely, prices are falling when signals are negative. As an advance rises, the Rate Of Change signal should also rise higher, otherwise the rally is suspect. A decline should see the Rate Of Change fall into negative signals. The more negative the signals the stronger the decline. |
Stock Market Outlook: Support and Resistance Levels |
| 6125 is resistance |
| 6100 is resistance |
| 6075 is resistance |
| 6050 is resistance |
| 6025 is resistance |
| 6015 is resistance |
| 6000 is resistance |
| 5990 is resistance |
| 5975 is resistance |
| 5950 is resistance |
| 5925 is resistance |
| 5900 is support |
| 5850 is support |
| 5800 is support |
| 5785 is support |
| 5750 is support |
| 5700 is support |
| 5650 is support |
| 5630 is support |
| 5600 is support |
| 5550 is support |
| 5500 is support |
Stock Market Outlook for Wed Jun 25 2025
With the SPX back above 6000, the 5900 valuation becomes support which is important for the rally to be able to continue.
The technical indicators have shifted back toward up and Wednesday is expected to end higher still.
On Wednesday, stocks will continue their rally and end the day higher.
Potential Economic and Political Market Moving Events
Monday:
9:45 S&P flash services PMI icame in as expected at 53.1
9:45 S&P flash manufacturing PMI came in as estimated at 52.0
10:00 Existing home sales for May rose more than estimated, reaching 4.03 million versus 4.0 million prior
Tuesday:
9:00 Case-Shiller home price index of 20 cities is dipped far more than expected, coming in at 3.4%
10:00 Consumer confidence for June fell to 93.0 which was unexpected
10:00 Fed Chair Powell testifies to House Financial Service Committee
Wednesday:
10:00 New home sales are expected to slip to 695,000 from 743,000 prior