

Tuesday saw the S&P dip back from setting an all-time new high on Monday. By the close the index was down just 8 points as investors prepare to see what the Fed’s stance will be on Wednesday. The majority of analysts believe the Fed will not change course at this point in time but there could be “rumblings” of change to its bond buying program. In other words, change to quantitative easing. That could lead to a move either way, up or down.
While the Fed’s decision Wednesday afternoon will most likely determine the market’s direction, let’s still review the technical indicators from Tuesday’s close to see what they are advising for investors.
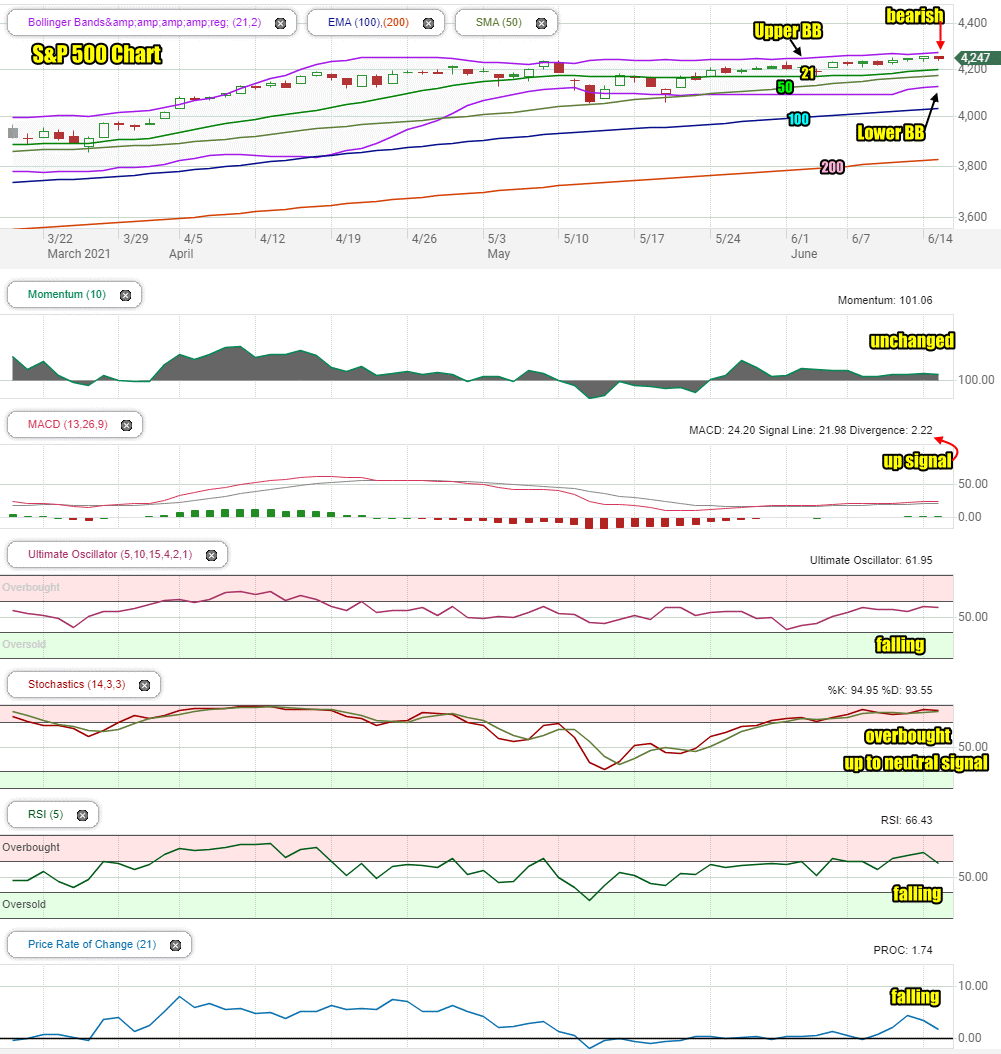
Stock Market Outlook Chart Comments At The Close on Tue Jun 15 2021
The SPX ended the day slightly lower and left behind another doji candlestick which, this time, is bearish for Wednesday.
Two events are still of importance. The Upper Bollinger Band is not rising and the Lower Bollinger Band is turning back up, both of which is bearish.
The other is the 21 day is finally moving higher, away from the 50 day which is a bullish sign.
Meanwhile the 50, 100 and 200 day moving averages are climbing. These are bullish signals.
Overall the SPX chart is still more bullish than bearish but the the Bollinger Bands is significant and needs to be watched.
One other technical indicator to mention is the number of doji candlesticks that are short tops with a long shadow since April as the index has pushed above the 4200 level. Normally this many “doji” candlesticks over such a long period of time can be bearish. Also note how long the Bollinger Bands have stayed close to each other since the middle of May. Again this is bearish. While perhaps not a major concern at this point, both of these signals need to be watched for any further signals that advise the index will dip lower before trying for another rally.
Stock Market Outlook review of Tue Jun 15 2021
Stock Market Outlook: Technical Indicators Review:
Momentum: Momentum is unchanged and positive.
- Settings: For momentum I use a 10 period when studying market direction.
MACD Histogram: MACD (Moving Averages Convergence / Divergence) issued an up signal on Friday May 28 2021. On Tuesday the up signal was slightly weaker.
- Settings: For MACD Histogram, I am using the Fast Points set at 13, Slow Points at 26 and Smoothing at 9.
Ultimate Oscillator: The Ultimate Oscillator is falling.
- Settings: The Ultimate Oscillator settings are: Period 1 is 5, Period 2 is 10, Period 3 is 15, Factor 1 is 4, Factor 2 is 2 and Factor 3 is 1. These are not the default settings but are the settings I use with the S&P 500 chart set for 1 to 3 months.
Slow Stochastic: The Slow Stochastic has an up to neutral signal in place for tomorrow and is very overbought.
Settings: For the Slow Stochastic I use the K period of 14 and D period of 3. The Slow Stochastic tries to predict the market direction further out than just one day.
Relative Strength Index: The RSI signal is falling.
- Settings: The relative strength index is set for a period of 5 which gives it 5 days of market movement to monitor. It is often the first indicator to show an overbought or oversold signal.
Rate of Change: The rate of change signal is falling sharply which normally indicates investors should not expect a big change in prices, up or down.
- Settings: Rate Of Change is set for a 21 period. This indicator looks back 21 days and compares price action from the past to the present. With the Rate Of Change, prices are rising when signals are positive. Conversely, prices are falling when signals are negative. As an advance rises the Rate Of Change signal should also rise higher, otherwise the rally is suspect. A decline should see the Rate Of Change fall into negative signals. The more negative the signals the stronger the decline.
Support and Resistance Levels To Be Aware Of:
4250 is resistance
4225 is resistance
4200 is resistance
4150 is light support
4100 is light support
4070 is very light support
4050 is light support and where the 50 day is currently residing. This would represent a 4.4% decline.
4000 is good support
3900 is support and just below the 100 day moving average.
3850 is support
3800 is support
3750 is good support
3700 is light support and just below the 200 day moving average.
3680 is light support
3600 is strong support
Stock Market Outlook for Tomorrow – Wed Jun 16 2021
Wednesday will primarily be about the Fed but the technical indicators are advising investors to stay cautious but keep a bullish stance.
There are signals pointing to both up and down for the market, but the large number of almost unchanged candlesticks, day after day since April is a major concern and usually ends with the market slipping lower before finding more buyers to commence a new rally.
The technical indicators are relatively split although most still are holding a bullish stance. For Wednesday we could see the market make a bigger move, up or down, after the Fed’s announcement but after Wednesday, investors should check the technical indicators again to see if there are significant changes to the bullish stance.
Stock Market Outlook Archives
Stock Market Outlook For Wed May 6 2026 – Choppy But Higher Still

Morning Investing Strategy Notes for Tue May 5 2026

Stock Market Outlook For Tue May 5 2026 – Overbought and Lower

Morning Investing Strategy Notes for Mon May 4 2026
Stock Market Outlook For Mon May 4 2026 – Dips Likely With Possible Lower Close

Morning Investing Strategy Notes for Fri May 1 2026
Stock Market Outlook For Fri May 1 2026 – Overbought But Higher

Morning Investing Strategy Notes for Thu Apr 30 2026
Stock Market Outlook For Thu Apr 30 2026 – Dips Likely Possible Lower Close
Morning Investing Strategy Notes for Wed Apr 29 2026
Stock Market Outlook For Wed Apr 29 2026 – Choppy But Higher Ahead Of More Earnings

Morning Investing Strategy Notes for Tue Apr 28 2026