

Prior Trading Day Summary:
On Tue Jul 8 2025 investors were still contemplating the outcome of tariffs and its impact on the economy. Stocks wandered more than they had on Monday. By the close the SPX was slightly negative while the NASDAQ managed to squeeze out a gain.
The SPX fell 4 points to close at 6225 on 5.8 billion shares, 500 million more than we saw on Monday. 60% of all stocks were rising by the close.
The NASDAQ rose 6 points to 20,418. Volume was 8.6 billion, 100 million more shares than Monday’s trading. 70% of the volume was being traded higher by the close and 60% of all stocks on the index were rising.
There were signs that the selling may be ending or at least, is contained, by the close on Tuesday.
Let’s review the technical indicators at the close on Tue Jul 8 2025 to see what they predict for Wed Jul 9 2025.
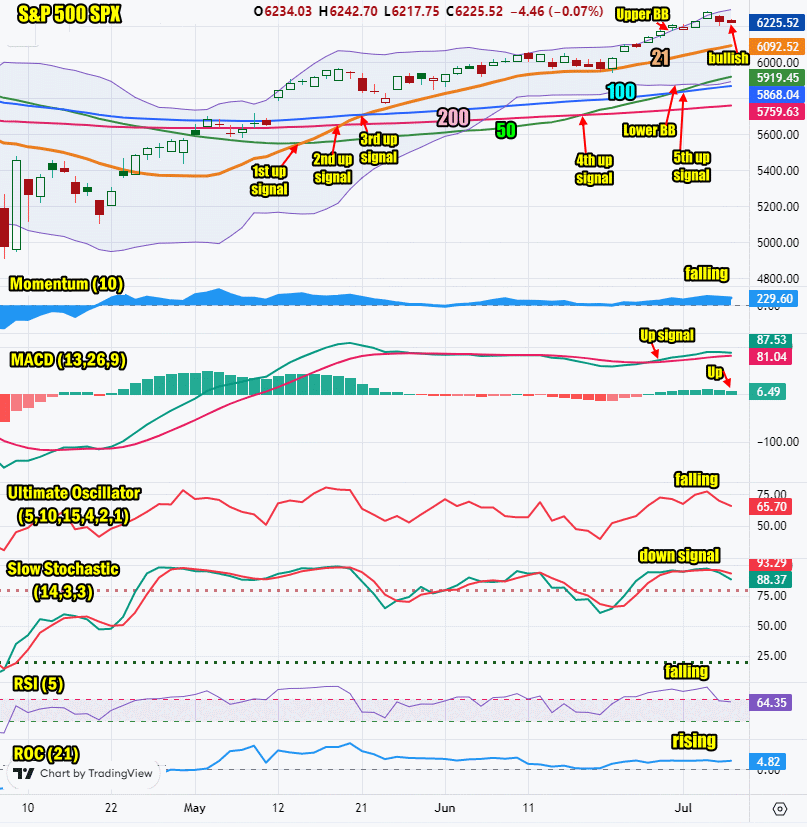
Stock Market Outlook: SPX Closing Chart For Tue Jul 8 2025
The index closed below the Upper Bollinger Band. This is bullish.
The closing candlestick is bearish for Wednesday but with indications the index may try to move higher.
The 21 day moving average is rising and closed at 6092 which is bullish.
The 50 day moving average is rising and closed at 5919 which is bullish.
The 100 day moving average is rising and closed at 5868 which is bullish.
The 200 day moving average is rising and closed at 5759 which is bullish.
The Lower Bollinger Band is starting to turn higher but is still below the 50 day moving average. Sometimes this signals a change in direction for stocks. This is bearish. The Upper Bollinger Band is rising which is bullish.
The SPX chart is still bullish but there are some signs that weakness is developing.
SPX Stock Market Outlook review of Tue Jul 8 2025
Stock Market Outlook: Technical Indicators Review
Momentum: Momentum is falling and positive.
|
MACD Histogram: MACD (Moving Averages Convergence / Divergence) issued an up signal on Thu June 26. On Tue Jul 8 2025 the up signal lost strength.
|
Ultimate Oscillator: The Ultimate Oscillator is falling.
|
Slow Stochastic: The Slow Stochastic has a down signal.
|
Relative Strength Index: The RSI signal is falling.
|
| Rate of Change: The rate of change signal is rising which signals a larger move is expected, either up or down. Settings: Rate Of Change is set for a 21 period. This indicator looks back 21 days and compares price action from the past to the present. With the Rate Of Change, prices are rising when signals are positive. Conversely, prices are falling when signals are negative. As an advance rises, the Rate Of Change signal should also rise higher, otherwise the rally is suspect. A decline should see the Rate Of Change fall into negative signals. The more negative the signals the stronger the decline. |
Stock Market Outlook: Support and Resistance Levels |
| 6300 is resistance |
| 6250 is resistance |
| 6225 is resistance |
| 6200 is resistance |
| 6175 is resistance |
| 6150 is resistance |
| 6125 is resistance |
| 6100 is resistance |
| 6075 is resistance |
| 6050 is resistance |
| 6025 is resistance |
| 6015 is resistance |
| 6000 is resistance |
| 5990 is support |
| 5975 is support |
| 5950 is support |
| 5925 is support |
| 5900 is support |
| 5850 is support |
| 5800 is support |
| 5785 is support |
| 5750 is support |
| 5700 is support |
Stock Market Outlook for Wed Jul 9 2025
For Wednesday, we get the latest FOMC minutes which are not expected to provide anything new or market moving. These are released at 2:00 PM.
The outlook is for a weaker morning but the close still has a chance to end higher unless something on the tariff front surprises investors. At present, most investors are taking the various announcements, in stride.
Potential Economic and Political Market Moving Events
Monday:
no events are scheduled
Tuesday:
6:00 NFIB optimism index was slightly lower at 98.6
3:00 Consumer credit was better than expected, coming in at $5.1 billion, roughly half of what was estimated.
Wednesday:
10:00 Wholesale inventories are estimated to fall to -0.3% from 2.0% prior
2:00 Latest FOMC minutes