

Tuesday saw the S&P tumble and wipe out Friday’s gain by midday. Buyers then returned and as we have seen so many times this year, they pushed sellers aside and ended the day with the S&P down just 8 points to 4343.
The technical indicators by the close were still holding a bullish stance but there are changes to be aware of for Wednesday.
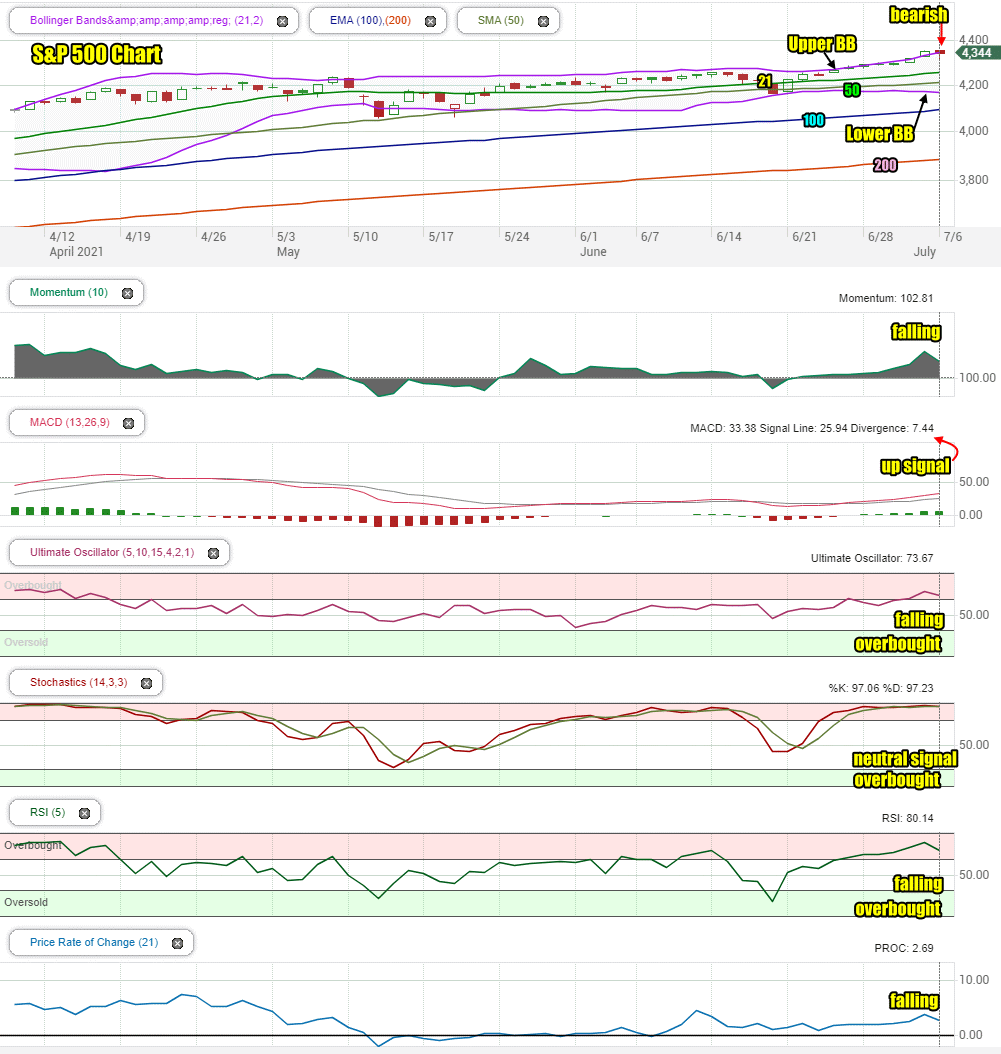
Stock Market Outlook Chart Comments At The Close on Tue Jul 6 2021
The S&P closed at the Upper Bollinger Band. The Lower Bollinger Band continued to fall on Tuesday which is bullish.
The closing candlestick on Tuesday is bearish for Wednesday.
The 21, 50, 100 and 200 day moving averages are climbing which are bullish signals. At the close on Tuesday there was only one bearish signal, the closing candlestick.
Stock Market Outlook review of Tue Jul 6 2021
Stock Market Outlook: Technical Indicators Review:
Momentum: Momentum is falling and positive. It is signaling we should expect further weakness on Tuesday.
- Settings: For momentum I use a 10 period when studying market direction.
MACD Histogram: MACD (Moving Averages Convergence / Divergence) issued an up signal on Friday June 25. That up signal was strong on Tuesday.
- Settings: For MACD Histogram, I am using the Fast Points set at 13, Slow Points at 26 and Smoothing at 9.
Ultimate Oscillator: The Ultimate Oscillator is falling and signaling overbought.
- Settings: The Ultimate Oscillator settings are: Period 1 is 5, Period 2 is 10, Period 3 is 15, Factor 1 is 4, Factor 2 is 2 and Factor 3 is 1. These are not the default settings but are the settings I use with the S&P 500 chart set for 1 to 3 months.
Slow Stochastic: The Slow Stochastic has a neutral signal in place for Wednesday and is signaling extremely overbought.
Settings: For the Slow Stochastic I use the K period of 14 and D period of 3. The Slow Stochastic tries to predict the market direction further out than just one day.
Relative Strength Index: The RSI signal is falling and still showing overbought readings.
- Settings: The relative strength index is set for a period of 5 which gives it 5 days of market movement to monitor. It is often the first indicator to show an overbought or oversold signal.
Rate of Change: The rate of change signal is falling.
- Settings: Rate Of Change is set for a 21 period. This indicator looks back 21 days and compares price action from the past to the present. With the Rate Of Change, prices are rising when signals are positive. Conversely, prices are falling when signals are negative. As an advance rises the Rate Of Change signal should also rise higher, otherwise the rally is suspect. A decline should see the Rate Of Change fall into negative signals. The more negative the signals the stronger the decline.
Support and Resistance Levels To Be Aware Of:
4350 is resistance
4300 is resistance
4290 is resistance
4270 is light support
4250 is light support
4225 is light support
4200 is light support
4175 is light support
4150 is light support
4100 is good support
4070 is light support
4050 is light support
4000 is good support
3900 is support
3850 is support
3800 is support
3750 is good support
3700 is light support
3680 is light support
3600 is strong support
Stock Market Outlook for Tomorrow – Wed Jul 7 2021
For Wednesday there are still overbought signals to contend with. As well we get the Fed’s note in the afternoon which may impact the market although I am not expecting anything unknown to be found.
The outlook is for more dips but not as deep as we saw on Tuesday. The close on Wednesday has a good chance of being higher.
Stock Market Outlook Archives
Stock Market Outlook For Wed May 6 2026 – Choppy But Higher Still

Morning Investing Strategy Notes for Tue May 5 2026

Stock Market Outlook For Tue May 5 2026 – Overbought and Lower

Morning Investing Strategy Notes for Mon May 4 2026
Stock Market Outlook For Mon May 4 2026 – Dips Likely With Possible Lower Close

Morning Investing Strategy Notes for Fri May 1 2026
Stock Market Outlook For Fri May 1 2026 – Overbought But Higher

Morning Investing Strategy Notes for Thu Apr 30 2026
Stock Market Outlook For Thu Apr 30 2026 – Dips Likely Possible Lower Close
Morning Investing Strategy Notes for Wed Apr 29 2026
Stock Market Outlook For Wed Apr 29 2026 – Choppy But Higher Ahead Of More Earnings

Morning Investing Strategy Notes for Tue Apr 28 2026